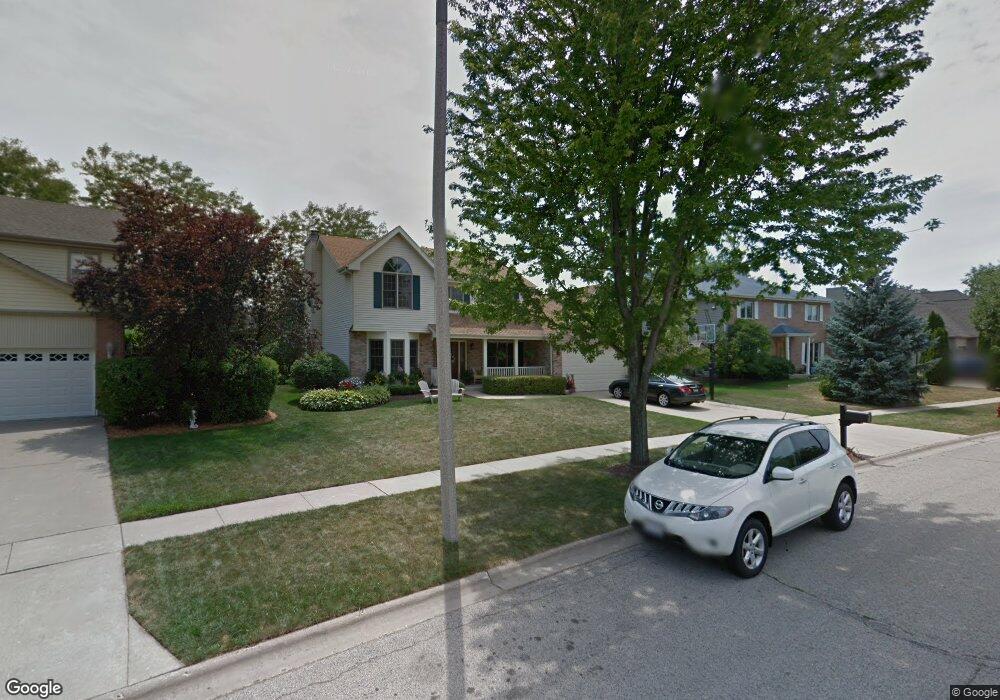
2061 Carlisle St Algonquin, IL 60102
Estimated Value: $456,141 - $510,000
4
Beds
3
Baths
2,317
Sq Ft
$208/Sq Ft
Est. Value
About This Home
This home is located at 2061 Carlisle St, Algonquin, IL 60102 and is currently estimated at $481,535, approximately $207 per square foot. 2061 Carlisle St is a home located in McHenry County with nearby schools including Westfield Community School, Kenneth E Neubert Elementary School, and United Junior High School.
Ownership History
Date
Name
Owned For
Owner Type
Purchase Details
Closed on
Aug 18, 1999
Sold by
Grove Jeffrey O and Grove Theresa L
Bought by
Schoemann Randall N and Schoemann Cynthia K
Current Estimated Value
Home Financials for this Owner
Home Financials are based on the most recent Mortgage that was taken out on this home.
Original Mortgage
$150,000
Interest Rate
7.91%
Purchase Details
Closed on
Jul 18, 1996
Sold by
Boehm Robert A
Bought by
Grove Jeffrey O and Grove Theresa L
Home Financials for this Owner
Home Financials are based on the most recent Mortgage that was taken out on this home.
Original Mortgage
$130,000
Interest Rate
7.12%
Purchase Details
Closed on
Apr 26, 1994
Sold by
Steel City Bank Of Chicago
Bought by
Boehm Robert A
Home Financials for this Owner
Home Financials are based on the most recent Mortgage that was taken out on this home.
Original Mortgage
$810,000
Interest Rate
7.88%
Create a Home Valuation Report for This Property
The Home Valuation Report is an in-depth analysis detailing your home's value as well as a comparison with similar homes in the area
Home Values in the Area
Average Home Value in this Area
Purchase History
| Date | Buyer | Sale Price | Title Company |
|---|---|---|---|
| Schoemann Randall N | $228,500 | -- | |
| Grove Jeffrey O | $206,000 | Attorneys Natl Title Network | |
| Boehm Robert A | $48,500 | -- |
Source: Public Records
Mortgage History
| Date | Status | Borrower | Loan Amount |
|---|---|---|---|
| Previous Owner | Schoemann Randall N | $150,000 | |
| Previous Owner | Grove Jeffrey O | $130,000 | |
| Previous Owner | Boehm Robert A | $810,000 |
Source: Public Records
Tax History Compared to Growth
Tax History
| Year | Tax Paid | Tax Assessment Tax Assessment Total Assessment is a certain percentage of the fair market value that is determined by local assessors to be the total taxable value of land and additions on the property. | Land | Improvement |
|---|---|---|---|---|
| 2024 | $10,584 | $143,299 | $28,348 | $114,951 |
| 2023 | $10,059 | $128,163 | $25,354 | $102,809 |
| 2022 | $9,102 | $112,136 | $31,795 | $80,341 |
| 2021 | $8,737 | $104,468 | $29,621 | $74,847 |
| 2020 | $8,510 | $100,769 | $28,572 | $72,197 |
| 2019 | $8,305 | $96,448 | $27,347 | $69,101 |
| 2018 | $7,921 | $89,098 | $25,263 | $63,835 |
| 2017 | $7,761 | $83,936 | $23,799 | $60,137 |
| 2016 | $7,648 | $78,724 | $22,321 | $56,403 |
| 2013 | -- | $74,973 | $20,823 | $54,150 |
Source: Public Records
Map
Nearby Homes
- 2043 Peach Tree Ln Unit 4122
- 2161 Burnham Ct
- 1971 Peach Tree Ln
- 000 County Line Rd
- 1900 Waverly Ln
- 30 Arbordale Ct Unit 4284
- 2060 Dorchester Ave
- 1820 Crofton Dr
- 741 Regal Ln
- Adams Plan at Algonquin Meadows - Single Family
- Sequoia Plan at Algonquin Meadows - Single Family
- Bryce Plan at Algonquin Meadows - Single Family
- Rainier Plan at Algonquin Meadows - Single Family
- Santa Rosa Plan at Algonquin Meadows - Single Family
- Biscayne Plan at Algonquin Meadows - Single Family
- Marianne Plan at Algonquin Meadows - Traditional Townhomes
- Darcy Plan at Algonquin Meadows - Traditional Townhomes
- Charlotte Plan at Algonquin Meadows - Traditional Townhomes
- 2235 Dawson Ln
- Amherst Plan at Algonquin Meadows - Urban Townhomes
- 2041 Carlisle St
- 2081 Carlisle St
- 2021 Carlisle St
- 2101 Carlisle St
- 2040 Carlisle St
- 2060 Carlisle St
- 36 Peach Tree Ct Unit 4166
- 30 Peach Tree Ct Unit 4163
- 32 Peach Tree Ct Unit 4164
- 34 Peach Tree Ct Unit 4165
- 2121 Carlisle St
- 2001 Carlisle St
- 26 Peach Tree Ct Unit 4161
- 2020 Carlisle St
- 2000 Carlisle St
- 20 Peach Tree Ct Unit 4153
- 24 Peach Tree Ct Unit 4151
- 22 Peach Tree Ct Unit 4152
- 18 Peach Tree Ct Unit 4154
- 16 Peach Tree Ct Unit 4155