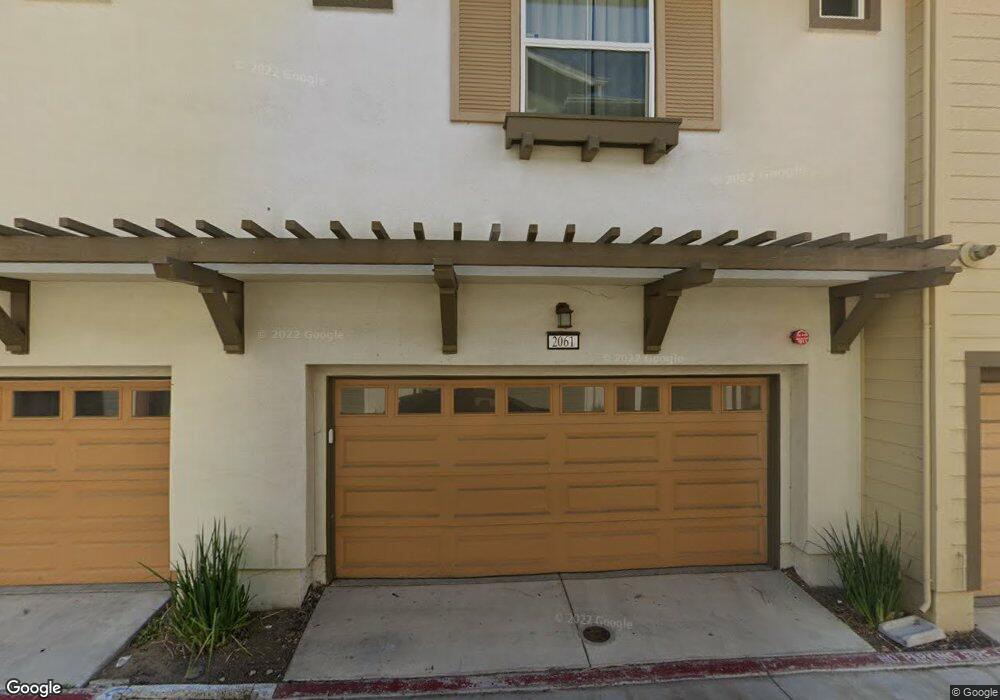
2061 Kiwi Walkway Unit WW San Jose, CA 95133
Commodore NeighborhoodEstimated Value: $1,312,625 - $1,440,000
4
Beds
4
Baths
1,722
Sq Ft
$789/Sq Ft
Est. Value
About This Home
This home is located at 2061 Kiwi Walkway Unit WW, San Jose, CA 95133 and is currently estimated at $1,358,156, approximately $788 per square foot. 2061 Kiwi Walkway Unit WW is a home located in Santa Clara County with nearby schools including Vinci Park Elementary School, Piedmont Middle School, and Independence High School.
Ownership History
Date
Name
Owned For
Owner Type
Purchase Details
Closed on
Sep 13, 2021
Sold by
Zheng Hao
Bought by
Xue Chaomin and Yan Mengyun
Current Estimated Value
Home Financials for this Owner
Home Financials are based on the most recent Mortgage that was taken out on this home.
Original Mortgage
$992,000
Outstanding Balance
$901,299
Interest Rate
2.7%
Mortgage Type
New Conventional
Estimated Equity
$456,857
Purchase Details
Closed on
Jul 7, 2014
Sold by
Pulte Home Corporation
Bought by
Zheng Hao
Home Financials for this Owner
Home Financials are based on the most recent Mortgage that was taken out on this home.
Original Mortgage
$532,392
Interest Rate
4.12%
Mortgage Type
New Conventional
Create a Home Valuation Report for This Property
The Home Valuation Report is an in-depth analysis detailing your home's value as well as a comparison with similar homes in the area
Home Values in the Area
Average Home Value in this Area
Purchase History
| Date | Buyer | Sale Price | Title Company |
|---|---|---|---|
| Xue Chaomin | $1,240,000 | Chicago Title Company | |
| Zheng Hao | $698,000 | First American Title Company |
Source: Public Records
Mortgage History
| Date | Status | Borrower | Loan Amount |
|---|---|---|---|
| Open | Xue Chaomin | $992,000 | |
| Previous Owner | Zheng Hao | $532,392 |
Source: Public Records
Tax History Compared to Growth
Tax History
| Year | Tax Paid | Tax Assessment Tax Assessment Total Assessment is a certain percentage of the fair market value that is determined by local assessors to be the total taxable value of land and additions on the property. | Land | Improvement |
|---|---|---|---|---|
| 2025 | $17,289 | $1,225,000 | $612,500 | $612,500 |
| 2024 | $17,289 | $1,275,000 | $637,500 | $637,500 |
| 2023 | $15,892 | $1,160,000 | $580,000 | $580,000 |
| 2022 | $17,159 | $1,240,000 | $620,000 | $620,000 |
| 2021 | $10,942 | $774,569 | $387,279 | $387,290 |
| 2020 | $10,603 | $766,627 | $383,308 | $383,319 |
| 2019 | $10,197 | $751,596 | $375,793 | $375,803 |
| 2018 | $10,057 | $736,860 | $368,425 | $368,435 |
| 2017 | $10,126 | $722,412 | $361,201 | $361,211 |
| 2016 | $9,707 | $708,248 | $354,119 | $354,129 |
| 2015 | $9,601 | $697,610 | $348,800 | $348,810 |
| 2014 | $1,343 | $97,842 | $97,842 | $0 |
Source: Public Records
Map
Nearby Homes
- 2109 Kiwi Walkway
- 1116 Genco Terrace
- 1055 Thyme Walkway
- 1137 Mallow Terrace
- 1087 Yarrow Terrace
- 2044 Voss Park Ln
- 1049 Branbury Way
- 2328 Mossdale Way
- 1062 Rymar Place
- 985 Harcot Ct
- 990 Harcot Ct
- 970 E Harcot Ct
- Residence 2 Plan at Ascend
- Residence 1 Plan at Ascend
- Residence 3 Plan at Ascend
- 1055 N Capitol Ave Unit 124
- 1055 N Capitol Ave Unit 180
- 1055 N Capitol Ave Unit 51
- 832 N Jackson Ave
- 998 Harcot Ct
- 2061 Kiwi Walkway
- 2073 Kiwi Walkway
- 1091 Territo Terrace
- 1092 Mallow Terrace
- 2051 Kiwi Walkway Unit WW
- 2051 Kiwi Walkway
- 2074 Vincenzo Walkway
- 2074 Vincenzo Walkway Unit WW
- 1062 Coriander Walkway
- 1059 Chamomile Way
- 2062 Vincenzo Walkway Unit WW
- 2058 Vincenzo Walkway
- 2078 Vincenzo Walkway Unit WW
- 2045 Kiwi Walkway
- 1050 Chamomile Way
- 1056 Vanilla Walkway
- 1056 Vanilla Walkway Unit WW
- 1059 Chamomile Walkway
- 2046 Vincenzo Walkway Unit WW
- 2046 Vincenzo Walkway