Estimated Value: $285,000 - $400,000
3
Beds
2
Baths
1,421
Sq Ft
$249/Sq Ft
Est. Value
About This Home
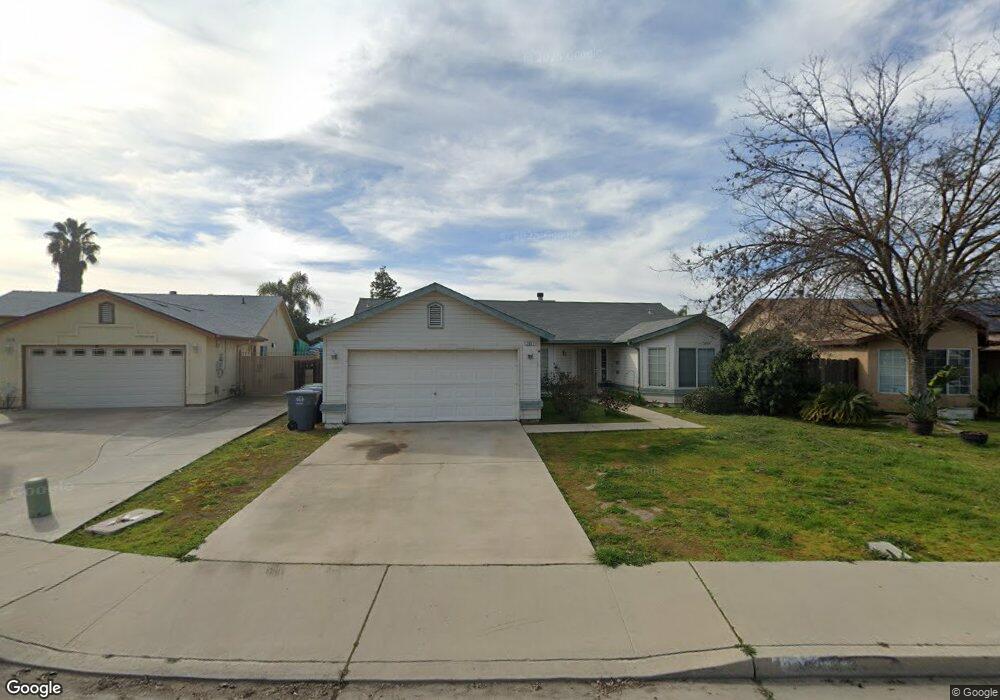
This home is located at 2061 Snyder St, Selma, CA 93662 and is currently estimated at $353,352, approximately $248 per square foot. 2061 Snyder St is a home located in Fresno County with nearby schools including Eric White Elementary School, Abraham Lincoln Middle School, and Selma High School.
Ownership History
Date
Name
Owned For
Owner Type
Purchase Details
Closed on
May 4, 2016
Sold by
Holeman Russell R
Bought by
Holeman Daniel J
Current Estimated Value
Home Financials for this Owner
Home Financials are based on the most recent Mortgage that was taken out on this home.
Original Mortgage
$115,500
Outstanding Balance
$92,095
Interest Rate
3.71%
Mortgage Type
New Conventional
Estimated Equity
$261,257
Purchase Details
Closed on
Oct 14, 2008
Sold by
Holmes David
Bought by
Holeman Russell R
Purchase Details
Closed on
Mar 6, 2000
Sold by
Holmes Robin Obrien
Bought by
Holmes David
Purchase Details
Closed on
Nov 11, 1999
Sold by
Holeman Virginia B
Bought by
Holmes David
Purchase Details
Closed on
Sep 23, 1994
Sold by
Too Briarwood
Bought by
Holeman Virginia B
Home Financials for this Owner
Home Financials are based on the most recent Mortgage that was taken out on this home.
Original Mortgage
$70,500
Interest Rate
9.27%
Create a Home Valuation Report for This Property
The Home Valuation Report is an in-depth analysis detailing your home's value as well as a comparison with similar homes in the area
Home Values in the Area
Average Home Value in this Area
Purchase History
We collect this data history from publicly available records. To have your information removed, we recommend requesting removal directly through your county’s website.
| Date | Buyer | Sale Price | Title Company |
|---|---|---|---|
| Holeman Daniel J | $160,000 | Stewart Title Of Ca Inc | |
| Holeman Russell R | -- | None Available | |
| Holmes David | -- | Chicago Title Co | |
| Holmes David | $76,000 | Chicago Title Co | |
| Holeman Virginia B | $88,500 | Chicago Title Company |
Source: Public Records
Mortgage History
We collect this data history from publicly available records. To have your information removed, we recommend requesting removal directly through your county’s website.
| Date | Status | Borrower | Loan Amount |
|---|---|---|---|
| Open | Holeman Daniel J | $115,500 | |
| Previous Owner | Holeman Virginia B | $70,500 |
Source: Public Records
Tax History
| Year | Tax Paid | Tax Assessment Tax Assessment Total Assessment is a certain percentage of the fair market value that is determined by local assessors to be the total taxable value of land and additions on the property. | Land | Improvement |
|---|---|---|---|---|
| 2025 | $3,250 | $189,400 | $59,186 | $130,214 |
| 2023 | $2,711 | $182,047 | $56,889 | $125,158 |
| 2022 | $2,991 | $178,478 | $55,774 | $122,704 |
| 2021 | $2,919 | $174,980 | $54,681 | $120,299 |
| 2020 | $2,888 | $173,187 | $54,121 | $119,066 |
| 2019 | $2,812 | $169,792 | $53,060 | $116,732 |
| 2018 | $2,747 | $166,464 | $52,020 | $114,444 |
| 2017 | $2,662 | $163,200 | $51,000 | $112,200 |
| 2016 | $2,515 | $170,000 | $50,000 | $120,000 |
| 2015 | $2,472 | $160,000 | $35,000 | $125,000 |
| 2014 | $2,592 | $173,400 | $66,100 | $107,300 |
Source: Public Records
Map
Nearby Homes
- 2662 Yerba St
- 2450 Knowles St
- 2546 Evergreen St
- 2595 Pine St
- 1939 Bauder St
- 2434 Yerba St
- 2772 Valley View St
- 2448 Snyder St
- 2469 Shaft St
- 1707 Sylvia St
- 2030 E Front St
- 2226 Arrants St
- 0 Rose Ave
- 1 Rose Ave
- 2232 Gaither St
- 2406 B St
- 2002 Merced St
- 12623 S Mccall Ave
- 1361 Almond St
- 12778 S Mccall Ave
- 1732 Cleveland St
- 1732 Cleveland St Unit 76
- 1720 Cleveland St Unit 71
- 1765 Cleveland St
- 1726 Cleveland St Unit 75
- 1720 Cleveland St
- 2050 Mitchell Ave
- 2062 Mitchell Ave
- 2048 Mitchell Ave
- 2059 Snyder St
- 2036 Mitchell Ave
- 2074 Mitchell Ave
- 2699 Walnut St
- 2073 Snyder St
- 2086 Mitchell Ave
- 2024 Mitchell Ave
- 2085 Snyder St
- 2693 Walnut St
- 2098 Mitchell Ave
- 2012 Mitchell Ave
Your Personal Tour Guide
Ask me questions while you tour the home.