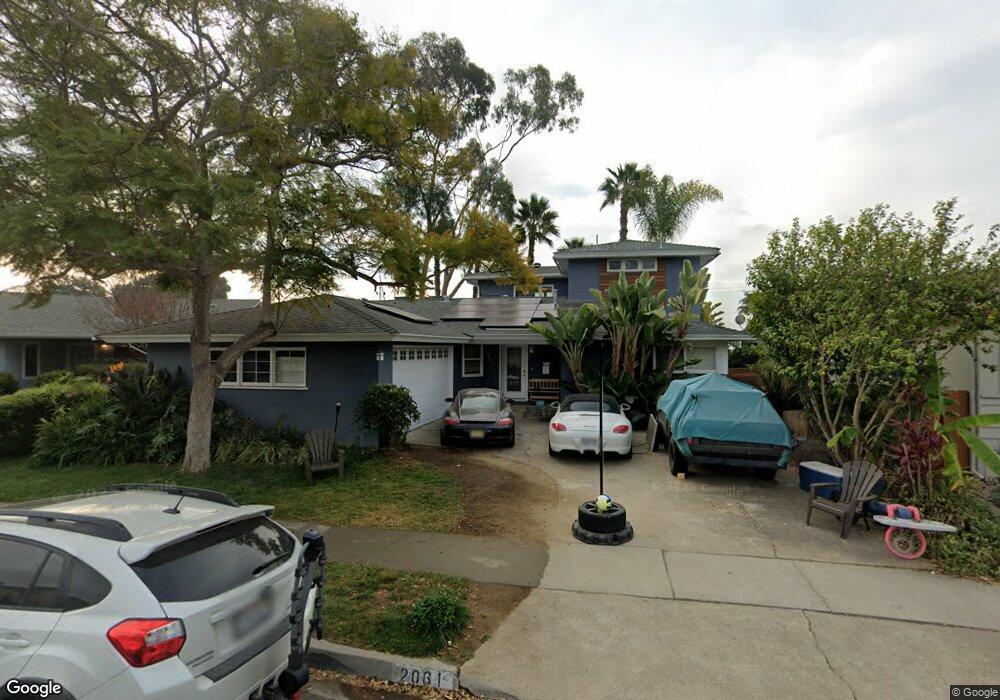
2061 Wilbur Ave San Diego, CA 92109
Pacific Beach NeighborhoodEstimated Value: $1,959,325 - $2,509,000
3
Beds
2
Baths
1,481
Sq Ft
$1,473/Sq Ft
Est. Value
About This Home
This home is located at 2061 Wilbur Ave, San Diego, CA 92109 and is currently estimated at $2,181,331, approximately $1,472 per square foot. 2061 Wilbur Ave is a home located in San Diego County with nearby schools including Sessions Elementary School, Pacific Beach Middle, and Mission Bay High School.
Ownership History
Date
Name
Owned For
Owner Type
Purchase Details
Closed on
Oct 21, 2016
Sold by
Mcclune Ryan and Mcclune Heidi
Bought by
Mcclune Ryan and Mcclune Heidi
Current Estimated Value
Home Financials for this Owner
Home Financials are based on the most recent Mortgage that was taken out on this home.
Original Mortgage
$580,750
Outstanding Balance
$466,170
Interest Rate
3.5%
Mortgage Type
New Conventional
Estimated Equity
$1,715,161
Purchase Details
Closed on
Feb 27, 2015
Sold by
Bischoff Eric and Wagner Brandee
Bought by
Mcclune Ryan and Bungeroth Heidi
Home Financials for this Owner
Home Financials are based on the most recent Mortgage that was taken out on this home.
Original Mortgage
$174,000
Interest Rate
3.7%
Mortgage Type
Credit Line Revolving
Purchase Details
Closed on
Jun 7, 2007
Sold by
Bischoff Eric and Wagner Brandee
Bought by
Bischoff Eric and Wagner Brandee
Purchase Details
Closed on
Oct 15, 2002
Sold by
Pidot Wendell K and Pidot Paula H
Bought by
Bischoff Eric and Wagner Brandee
Home Financials for this Owner
Home Financials are based on the most recent Mortgage that was taken out on this home.
Original Mortgage
$452,800
Interest Rate
6.09%
Purchase Details
Closed on
Nov 1, 1990
Create a Home Valuation Report for This Property
The Home Valuation Report is an in-depth analysis detailing your home's value as well as a comparison with similar homes in the area
Home Values in the Area
Average Home Value in this Area
Purchase History
| Date | Buyer | Sale Price | Title Company |
|---|---|---|---|
| Mcclune Ryan | -- | Provident Title Company | |
| Mcclune Ryan | $819,000 | Fidelity National Title | |
| Bischoff Eric | -- | None Available | |
| Bischoff Eric | -- | None Available | |
| Bischoff Eric | $566,000 | United Title Company | |
| -- | $273,000 | -- |
Source: Public Records
Mortgage History
| Date | Status | Borrower | Loan Amount |
|---|---|---|---|
| Open | Mcclune Ryan | $580,750 | |
| Closed | Mcclune Ryan | $174,000 | |
| Closed | Mcclune Ryan | $562,350 | |
| Previous Owner | Bischoff Eric | $452,800 | |
| Closed | Bischoff Eric | $56,600 |
Source: Public Records
Tax History Compared to Growth
Tax History
| Year | Tax Paid | Tax Assessment Tax Assessment Total Assessment is a certain percentage of the fair market value that is determined by local assessors to be the total taxable value of land and additions on the property. | Land | Improvement |
|---|---|---|---|---|
| 2025 | $13,371 | $1,114,819 | $782,578 | $332,241 |
| 2024 | $13,371 | $1,092,961 | $767,234 | $325,727 |
| 2023 | $13,075 | $1,071,532 | $752,191 | $319,341 |
| 2022 | $12,726 | $1,050,523 | $737,443 | $313,080 |
| 2021 | $12,637 | $1,029,926 | $722,984 | $306,942 |
| 2020 | $12,483 | $1,019,366 | $715,571 | $303,795 |
| 2019 | $10,817 | $882,380 | $701,541 | $180,839 |
| 2018 | $10,112 | $865,080 | $687,786 | $177,294 |
| 2017 | $9,870 | $848,118 | $674,300 | $173,818 |
| 2016 | $9,712 | $831,489 | $661,079 | $170,410 |
| 2015 | $7,959 | $682,071 | $542,283 | $139,788 |
| 2014 | $7,832 | $668,711 | $531,661 | $137,050 |
Source: Public Records
Map
Nearby Homes
- 1981 Wilbur Ave
- 1978 Beryl St
- 1897 Malden St
- 2104 Crownhill Rd
- 4750 Noyes St Unit 110
- 2002 Missouri St Unit 6
- 2128 Missouri St
- 4730 Noyes St Unit 106
- 4804 Lamont St
- 2020 Diamond St Unit 12
- 2315 Geranium St
- 4964 Kendall St
- 2318 Chalcedony St
- 2036-38 Emerald St
- 1715 Malden St
- 1645 Los Altos Rd
- 1828 Diamond St Unit 3
- 2045 Emerald St Unit 3
- 4600 Lamont St Unit 4-103
- 2114 Felspar St
- 2053 Wilbur Ave
- 2073 Wilbur Ave
- 2058 Beryl St
- 2041 Wilbur Ave
- 2048 Beryl St
- 2068 Beryl St
- 2060 Wilbur Ave
- 2038 Beryl St
- 4951 Academy St
- 2033 Wilbur Ave
- 2050 Wilbur Ave
- 4957 Academy St
- 2028 Beryl St
- 2040 Wilbur Ave
- 2025 Wilbur Ave
- 4960 Academy St
- 4961 Academy St
- 2030 Wilbur Ave
- 2020 Beryl St
- 4890 Academy St