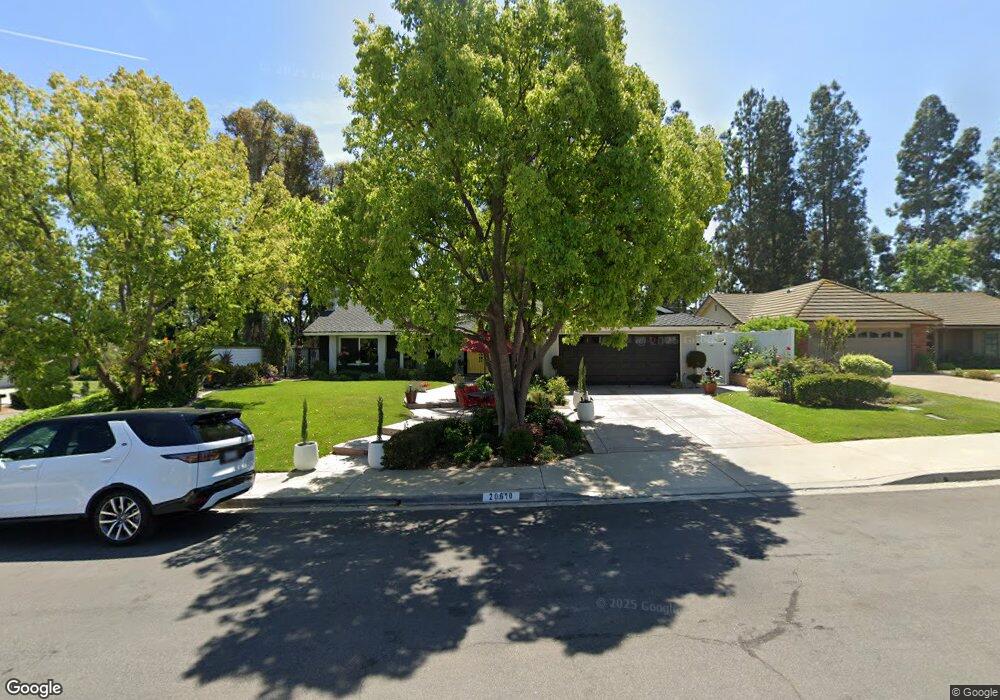
20610 Via Azul Yorba Linda, CA 92886
Estimated Value: $1,188,000 - $1,355,000
3
Beds
2
Baths
1,726
Sq Ft
$739/Sq Ft
Est. Value
About This Home
This home is located at 20610 Via Azul, Yorba Linda, CA 92886 and is currently estimated at $1,274,769, approximately $738 per square foot. 20610 Via Azul is a home located in Orange County with nearby schools including Travis Ranch Middle School, Yorba Linda High School, and Ivycrest Montessori Private School - Yorba Linda.
Ownership History
Date
Name
Owned For
Owner Type
Purchase Details
Closed on
Feb 18, 1998
Sold by
Flores Jennifer Quain
Bought by
Flores Augustine P
Current Estimated Value
Home Financials for this Owner
Home Financials are based on the most recent Mortgage that was taken out on this home.
Original Mortgage
$206,000
Interest Rate
7.11%
Purchase Details
Closed on
Jan 23, 1998
Sold by
Alan Pellegrini and Alan Denise
Bought by
Flores Augustine P
Home Financials for this Owner
Home Financials are based on the most recent Mortgage that was taken out on this home.
Original Mortgage
$206,000
Interest Rate
7.11%
Purchase Details
Closed on
Nov 17, 1993
Sold by
Larson James and Larson Carol
Bought by
Pellegrini Alan John and Pellegrini Denise Johnson
Home Financials for this Owner
Home Financials are based on the most recent Mortgage that was taken out on this home.
Original Mortgage
$228,150
Interest Rate
6.89%
Create a Home Valuation Report for This Property
The Home Valuation Report is an in-depth analysis detailing your home's value as well as a comparison with similar homes in the area
Home Values in the Area
Average Home Value in this Area
Purchase History
| Date | Buyer | Sale Price | Title Company |
|---|---|---|---|
| Flores Augustine P | -- | Orange Coast Title | |
| Flores Augustine P | $257,454 | Orange Coast Title | |
| Pellegrini Alan John | $253,500 | Orange Coast Title |
Source: Public Records
Mortgage History
| Date | Status | Borrower | Loan Amount |
|---|---|---|---|
| Previous Owner | Flores Augustine P | $206,000 | |
| Previous Owner | Pellegrini Alan John | $228,150 |
Source: Public Records
Tax History Compared to Growth
Tax History
| Year | Tax Paid | Tax Assessment Tax Assessment Total Assessment is a certain percentage of the fair market value that is determined by local assessors to be the total taxable value of land and additions on the property. | Land | Improvement |
|---|---|---|---|---|
| 2025 | $5,274 | $411,153 | $227,930 | $183,223 |
| 2024 | $5,274 | $403,092 | $223,461 | $179,631 |
| 2023 | $5,098 | $395,189 | $219,080 | $176,109 |
| 2022 | $5,053 | $387,441 | $214,785 | $172,656 |
| 2021 | $4,925 | $379,845 | $210,574 | $169,271 |
| 2020 | $4,772 | $375,951 | $208,415 | $167,536 |
| 2019 | $4,515 | $368,580 | $204,329 | $164,251 |
| 2018 | $4,466 | $361,353 | $200,322 | $161,031 |
| 2017 | $4,532 | $354,268 | $196,394 | $157,874 |
| 2016 | $4,289 | $347,322 | $192,543 | $154,779 |
| 2015 | $4,298 | $342,105 | $189,650 | $152,455 |
| 2014 | $4,203 | $335,404 | $185,935 | $149,469 |
Source: Public Records
Map
Nearby Homes
- 20660 Calle Feliz
- 20681 Via Amarilla
- 21590 Via Pepita
- 5151 Avenida de Amor
- 4418 Avenida Del Este
- 20361 Via Juana
- 20455 Via Cadiz
- 5505 Calle Vista Linda
- 20770 Paseo de la Rambla
- 4545 Avenida Rio Del Oro
- 4152 Beech Ave
- 4362 Via Alegre
- 4090 Naples Ct
- 21437 Zaca Ct
- 4446 Avenida de Las Flores
- 21620 Brisbane Way
- 5795 Via Perla
- 21451 Cloud Ridge
- 20100 Livorno Ln
- Cielo Vista 3 Plan at Cielo Vista
- 20608 Via Azul
- 4780 Avenida de Las Estrell
- 4770 Avenida de Las Estrell
- 20611 Via Azul
- 20606 Via Azul
- 20609 Via Azul
- 4760 Avenida de Las Estrell
- 4908 Via Ventosa
- 4905 Via Ventosa
- 20600 Via Azul
- 4920 Via Ventosa
- 4750 Avenida de Las Estrell
- 4750 Avenida de Las Estrellas
- 20605 Via Azul
- 20630 Via Roja
- 4907 Avenida de Las Estrell
- 20640 Via Roja
- 4761 Avenida de Los Suenos
- 4711 Avenida de Las Estrell
- 4919 Via Ventosa