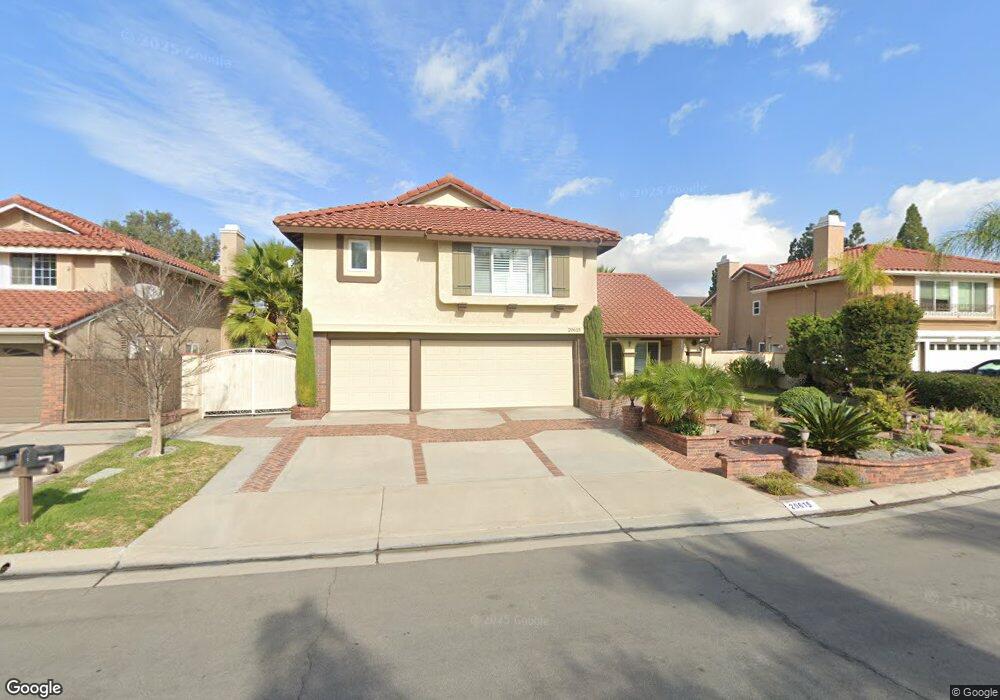
20615 Via Del Palmar Yorba Linda, CA 92886
Estimated Value: $1,613,671 - $1,663,000
4
Beds
3
Baths
2,477
Sq Ft
$664/Sq Ft
Est. Value
About This Home
This home is located at 20615 Via Del Palmar, Yorba Linda, CA 92886 and is currently estimated at $1,645,168, approximately $664 per square foot. 20615 Via Del Palmar is a home located in Orange County with nearby schools including Fairmont Elementary, Bernardo Yorba Middle School, and Ivycrest Montessori Private School - Yorba Linda.
Ownership History
Date
Name
Owned For
Owner Type
Purchase Details
Closed on
Sep 23, 2021
Sold by
Boots David and Boots Michelle
Bought by
Boots David and Boots Michelle
Current Estimated Value
Purchase Details
Closed on
Nov 1, 2016
Sold by
Boots David and Boots Michelle
Bought by
Boots David and Boots Michelle
Home Financials for this Owner
Home Financials are based on the most recent Mortgage that was taken out on this home.
Original Mortgage
$395,000
Outstanding Balance
$259,608
Interest Rate
4.14%
Mortgage Type
New Conventional
Estimated Equity
$1,385,560
Purchase Details
Closed on
Dec 29, 2015
Sold by
Boots David R and Boots Michelle L
Bought by
Boots Family Living Trust
Purchase Details
Closed on
Jul 22, 2009
Sold by
Fader Milton
Bought by
Boots David R and Boots Michelle L
Home Financials for this Owner
Home Financials are based on the most recent Mortgage that was taken out on this home.
Original Mortgage
$417,000
Interest Rate
5.17%
Mortgage Type
Purchase Money Mortgage
Create a Home Valuation Report for This Property
The Home Valuation Report is an in-depth analysis detailing your home's value as well as a comparison with similar homes in the area
Home Values in the Area
Average Home Value in this Area
Purchase History
| Date | Buyer | Sale Price | Title Company |
|---|---|---|---|
| Boots David | -- | Ticor Ttl Orange Cnty Branch | |
| Boots David | -- | Nationwide Title Clearing | |
| Boots Family Living Trust | -- | None Available | |
| Boots David R | $680,000 | Fidelity National Title |
Source: Public Records
Mortgage History
| Date | Status | Borrower | Loan Amount |
|---|---|---|---|
| Open | Boots David | $395,000 | |
| Closed | Boots David R | $417,000 |
Source: Public Records
Tax History Compared to Growth
Tax History
| Year | Tax Paid | Tax Assessment Tax Assessment Total Assessment is a certain percentage of the fair market value that is determined by local assessors to be the total taxable value of land and additions on the property. | Land | Improvement |
|---|---|---|---|---|
| 2025 | $10,124 | $877,754 | $589,951 | $287,803 |
| 2024 | $10,124 | $860,544 | $578,384 | $282,160 |
| 2023 | $9,940 | $843,671 | $567,043 | $276,628 |
| 2022 | $9,823 | $827,129 | $555,925 | $271,204 |
| 2021 | $9,641 | $810,911 | $545,024 | $265,887 |
| 2020 | $9,545 | $802,597 | $539,436 | $263,161 |
| 2019 | $9,174 | $786,860 | $528,859 | $258,001 |
| 2018 | $9,083 | $771,432 | $518,489 | $252,943 |
| 2017 | $8,931 | $756,306 | $508,322 | $247,984 |
| 2016 | $8,750 | $741,477 | $498,355 | $243,122 |
| 2015 | $8,639 | $730,340 | $490,869 | $239,471 |
| 2014 | $8,387 | $716,034 | $481,253 | $234,781 |
Source: Public Records
Map
Nearby Homes
- 20660 Calle Feliz
- 20709 Calle Pera
- 20455 Via Cadiz
- 4710 Avenida Del Este
- 5505 Calle Vista Linda
- 5289 Via Andalusia
- 4832 Via Frondosa
- 20770 Paseo de la Rambla
- 20681 Via Amarilla
- 21590 Via Pepita
- 5317 Via Ramon Rd
- 5244 Via Ramon Rd
- 20640 Smoketree Ave
- 4418 Avenida Del Este
- 4545 Avenida Rio Del Oro
- 5795 Via Perla
- 4362 Via Alegre
- 19862 Le Mans Cir
- 5851 Via Santana
- 19831 Caprice Dr
- 20605 Via Del Palmar
- 20625 Via Del Palmar
- 20620 Via Tapaste
- 20600 Via Tapaste
- 5195 Via Brumosa
- 20640 Via Tapaste
- 20635 Via Del Palmar
- 20610 Via Del Palmar
- 5160 Via Brumosa
- 20600 Via Del Palmar
- 20660 Via Tapaste
- 5205 Via Brumosa
- 5005 Via Marwah
- 4985 Via Marwah
- 5170 Via Brumosa
- 20605 Via Tapaste
- 20625 Via Tapaste
- 4965 Via Marwah
- 20645 Via Tapaste
- 20520 Via Del Palmar