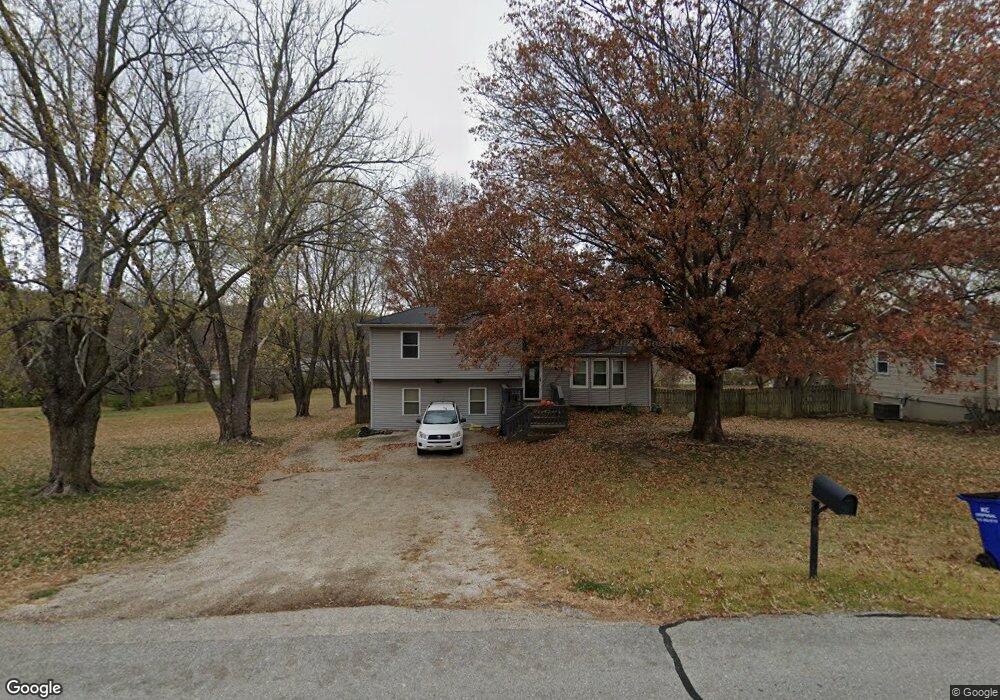
20616 W 71st St Shawnee, KS 66218
Estimated Value: $339,000 - $374,543
3
Beds
2
Baths
1,068
Sq Ft
$338/Sq Ft
Est. Value
About This Home
This home is located at 20616 W 71st St, Shawnee, KS 66218 and is currently estimated at $360,886, approximately $337 per square foot. 20616 W 71st St is a home located in Johnson County with nearby schools including Horizon Elementary School, Mill Creek Middle School, and Mill Valley High School.
Ownership History
Date
Name
Owned For
Owner Type
Purchase Details
Closed on
Oct 22, 2012
Sold by
Holdeman Brian
Bought by
Holdeman Tanis
Current Estimated Value
Purchase Details
Closed on
Oct 16, 2001
Sold by
Reimer Dorene A and Reimer Milan D
Bought by
Holdeman Brian G and Holdeman Tanis M
Home Financials for this Owner
Home Financials are based on the most recent Mortgage that was taken out on this home.
Original Mortgage
$40,337
Outstanding Balance
$15,743
Interest Rate
6.85%
Estimated Equity
$345,143
Purchase Details
Closed on
Jul 31, 2001
Sold by
Jones Stuart Galen and Jones Rebecca Paden
Bought by
Holdeman Tanis Marie and Reimer Dorene A
Home Financials for this Owner
Home Financials are based on the most recent Mortgage that was taken out on this home.
Original Mortgage
$130,150
Outstanding Balance
$50,402
Interest Rate
7.05%
Estimated Equity
$310,484
Create a Home Valuation Report for This Property
The Home Valuation Report is an in-depth analysis detailing your home's value as well as a comparison with similar homes in the area
Home Values in the Area
Average Home Value in this Area
Purchase History
| Date | Buyer | Sale Price | Title Company |
|---|---|---|---|
| Holdeman Tanis | -- | None Available | |
| Holdeman Brian G | -- | Assured Quality Title Co | |
| Holdeman Tanis Marie | -- | Chicago Title Insurance Co |
Source: Public Records
Mortgage History
| Date | Status | Borrower | Loan Amount |
|---|---|---|---|
| Open | Holdeman Brian G | $40,337 | |
| Open | Holdeman Tanis Marie | $130,150 |
Source: Public Records
Tax History Compared to Growth
Tax History
| Year | Tax Paid | Tax Assessment Tax Assessment Total Assessment is a certain percentage of the fair market value that is determined by local assessors to be the total taxable value of land and additions on the property. | Land | Improvement |
|---|---|---|---|---|
| 2024 | $4,375 | $37,810 | $10,454 | $27,356 |
| 2023 | $4,223 | $35,966 | $8,771 | $27,195 |
| 2022 | $3,663 | $30,569 | $7,316 | $23,253 |
| 2021 | $3,643 | $29,127 | $6,615 | $22,512 |
| 2020 | $3,290 | $26,051 | $6,615 | $19,436 |
| 2019 | $3,338 | $26,051 | $6,615 | $19,436 |
| 2018 | $2,878 | $22,234 | $6,615 | $15,619 |
| 2017 | $2,970 | $22,394 | $6,615 | $15,779 |
| 2016 | $2,834 | $21,098 | $6,615 | $14,483 |
| 2015 | $2,742 | $20,145 | $6,615 | $13,530 |
| 2013 | -- | $19,320 | $6,615 | $12,705 |
Source: Public Records
Map
Nearby Homes
- 20805 W 68th Terrace
- 20721 W 72nd Terrace
- The Denali Plan at Parkside Reserve
- Crestwood Plan at Parkside Reserve - Premier Collection
- Avalon Plan at Parkside Reserve - Premier Collection
- Birmingham III Plan at Parkside Reserve
- The Biscayne Plan at Parkside Reserve
- Adeline Plan at Parkside Reserve
- Lexington Plan at Parkside Reserve - Premier Collection
- The Squoia Parkside Plan at Parkside Reserve
- The Acadia Plan at Parkside Reserve
- 15517 W 168th Terrace
- The Sandstone Plan at Parkside Reserve
- Asheville 2 Story Plan at Parkside Reserve
- Brookside Plan at Parkside Reserve - Premier Collection
- The Olympia Plan at Parkside Reserve
- The Hudson Plan at Parkside Reserve
- Marietta Plan at Parkside Reserve
- The Sierra Parkside Plan at Parkside Reserve
- The Yellowstone Plan at Parkside Reserve
- 20610 W 71st St
- 20720 W 71st St
- 7108 Millbrook St
- 7105 Millbrook St
- 20740 W 71st St
- 7114 Millbrook St
- 20523 W 71st St
- 7103 Woodland Dr
- 7109 Millbrook St
- 7003 Martindale Rd
- 7111 Woodland Dr
- 7011 Martindale Rd
- 6928 Martindale Rd
- 7115 Woodland Dr
- 7113 Millbrook St
- 6932 Martindale Rd
- 7119 Woodland Dr
- 7117 Millbrook St
- 7018 Woodland Dr
- 7018 Woodland Rd