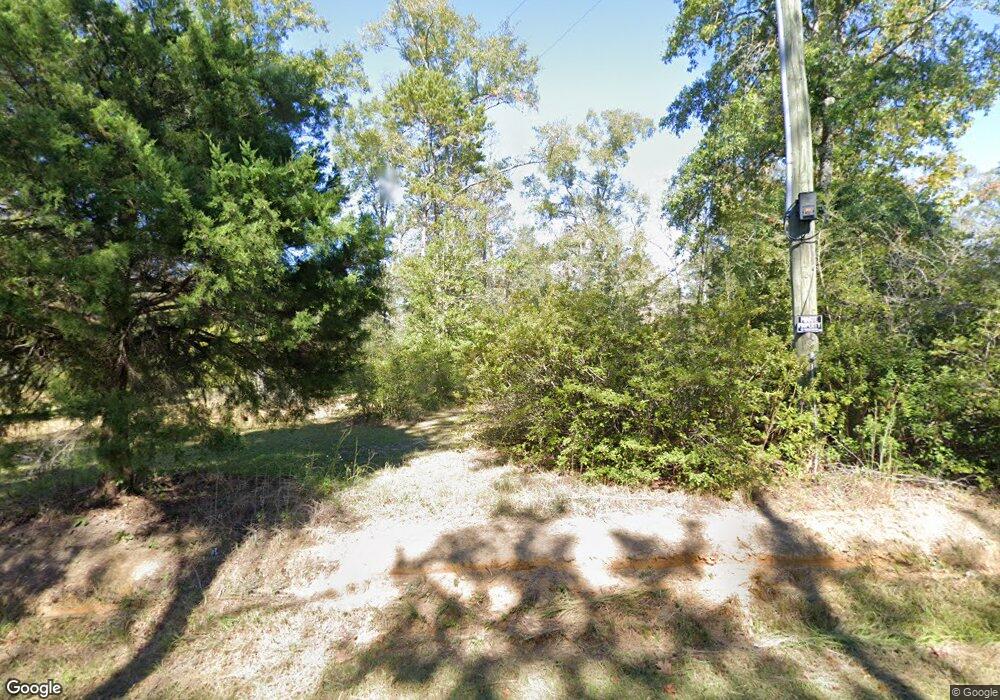
20617 Busby Rd Vancleave, MS 39565
Estimated Value: $239,315 - $647,000
--
Bed
2
Baths
1,458
Sq Ft
$278/Sq Ft
Est. Value
About This Home
This home is located at 20617 Busby Rd, Vancleave, MS 39565 and is currently estimated at $404,772, approximately $277 per square foot. 20617 Busby Rd is a home located in Jackson County with nearby schools including Vancleave Upper Elementary School, Vancleave Lower Elementary School, and Vancleave Middle School.
Ownership History
Date
Name
Owned For
Owner Type
Purchase Details
Closed on
May 30, 2025
Sold by
Helton Katherine B and Helton Charles Brady
Bought by
Ratliff Jack Christopher and Pope Jasmine Renae
Current Estimated Value
Home Financials for this Owner
Home Financials are based on the most recent Mortgage that was taken out on this home.
Original Mortgage
$60,000
Outstanding Balance
$58,944
Interest Rate
6.83%
Mortgage Type
New Conventional
Estimated Equity
$345,828
Create a Home Valuation Report for This Property
The Home Valuation Report is an in-depth analysis detailing your home's value as well as a comparison with similar homes in the area
Home Values in the Area
Average Home Value in this Area
Purchase History
| Date | Buyer | Sale Price | Title Company |
|---|---|---|---|
| Ratliff Jack Christopher | -- | Island Winds Title | |
| Ratliff Jack Christopher | -- | Island Winds Title |
Source: Public Records
Mortgage History
| Date | Status | Borrower | Loan Amount |
|---|---|---|---|
| Open | Ratliff Jack Christopher | $60,000 | |
| Closed | Ratliff Jack Christopher | $60,000 |
Source: Public Records
Tax History Compared to Growth
Tax History
| Year | Tax Paid | Tax Assessment Tax Assessment Total Assessment is a certain percentage of the fair market value that is determined by local assessors to be the total taxable value of land and additions on the property. | Land | Improvement |
|---|---|---|---|---|
| 2024 | $1,716 | $14,281 | $1,360 | $12,921 |
| 2023 | $1,716 | $10,230 | $1,168 | $9,062 |
| 2022 | $256 | $9,693 | $0 | $0 |
| 2021 | $259 | $9,725 | $7,591 | $2,134 |
| 2020 | $262 | $9,656 | $1,213 | $8,443 |
| 2019 | $263 | $9,690 | $1,247 | $8,443 |
| 2018 | $272 | $9,721 | $1,278 | $8,443 |
| 2017 | $275 | $9,707 | $1,264 | $8,443 |
| 2016 | $254 | $9,637 | $1,194 | $8,443 |
| 2015 | $156 | $81,810 | $8,760 | $73,050 |
| 2014 | $154 | $8,813 | $1,131 | $7,682 |
| 2013 | $109 | $8,460 | $1,079 | $7,381 |
Source: Public Records
Map
Nearby Homes
- 20915 Busby Rd
- 0 Busby Rd Unit 4006866
- 19640 Busby Rd Unit DRO
- 0 Jeremy Ln Unit 4120591
- 0 Hwy 57 Unit 4034427
- 0 E Spring Lake Dr
- 17220 Spring Lake Dr E
- 4901 Ashmore Ridge Dr
- 0 Ashmore Ridge Dr Unit 2019001027
- 17105 Spring Lake Dr W
- 16744 Spring Lake Dr W
- 17220 Old Kelly Rd
- 5432 Dogwood Dr
- 0 Ray Wilson Rd
- 17141 Hillcrest Dr
- 0 River Bluffs Lot 33 Dr
- Lot 111 River Place
- 0 Dr Unit 4052148
- 5701 Juniper Dr
- 2212 Sampras Blvd
- 20621 Busby Rd
- 20601 Busby Rd
- 20600 Busby Rd
- 20635 Busby Rd
- 20500 Busby Rd
- 20638 Busby Rd
- 20645 Busby Rd
- 20400 N Hills Ln
- 20911 Busby Rd
- 20636 Busby Rd
- 20501 Busby Rd
- 20301 N Hills Ln
- 20700 Busby Rd
- 20727 Busby Rd
- 20801 Busby Rd
- 20310 N Hills Ln
- 20211 N Hills Ln
- 20905 Busby Rd Unit DRO
- 20909 Busby Rd
- 20909 Busby Rd
