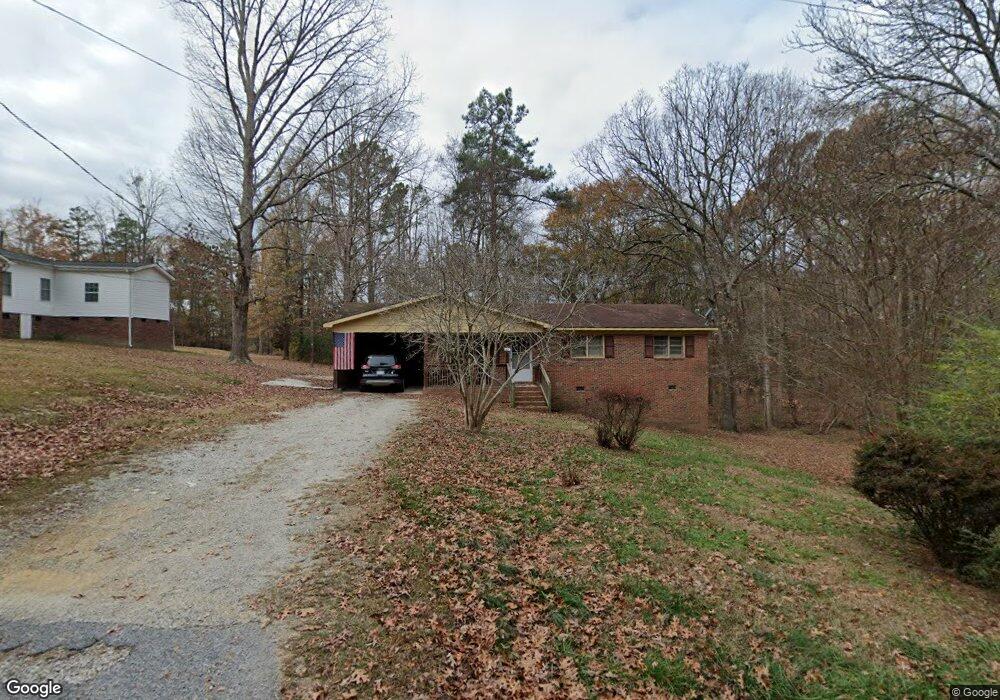
2062 Bacon St Lancaster, SC 29720
Estimated Value: $141,000 - $237,000
3
Beds
1
Bath
1,075
Sq Ft
$180/Sq Ft
Est. Value
About This Home
This home is located at 2062 Bacon St, Lancaster, SC 29720 and is currently estimated at $194,002, approximately $180 per square foot. 2062 Bacon St is a home located in Lancaster County with nearby schools including Brooklyn Springs Elementary School, South Middle School, and Lancaster High School.
Ownership History
Date
Name
Owned For
Owner Type
Purchase Details
Closed on
Jan 15, 2014
Sold by
No Limit Llc
Bought by
Simpson Erich and Erich Simpson Family Revocable
Current Estimated Value
Purchase Details
Closed on
Sep 18, 2009
Sold by
Citifinancial Inc
Bought by
No Limit Llc
Purchase Details
Closed on
Jul 14, 2009
Sold by
Lowery Catherine Jean and Bennett Billy Ray
Bought by
Citifinancial Inc
Purchase Details
Closed on
Jan 20, 2006
Sold by
Premier Aba Properties Llc
Bought by
Lowery Catherine Jean and Bennett Billy Ray
Home Financials for this Owner
Home Financials are based on the most recent Mortgage that was taken out on this home.
Original Mortgage
$13,370
Interest Rate
6.21%
Mortgage Type
Stand Alone Second
Purchase Details
Closed on
Mar 21, 2005
Sold by
Us Bank Na
Bought by
Caskey Shirley P and Caskey Amanda D
Purchase Details
Closed on
Sep 28, 2004
Sold by
Culp Anthony L and Chase Manhattan Mortgage Corp
Bought by
Us Bank Na
Create a Home Valuation Report for This Property
The Home Valuation Report is an in-depth analysis detailing your home's value as well as a comparison with similar homes in the area
Home Values in the Area
Average Home Value in this Area
Purchase History
| Date | Buyer | Sale Price | Title Company |
|---|---|---|---|
| Simpson Erich | -- | -- | |
| No Limit Llc | $32,900 | -- | |
| Citifinancial Inc | $10,000 | -- | |
| Lowery Catherine Jean | $66,847 | None Available | |
| Caskey Shirley P | $53,000 | -- | |
| Us Bank Na | $51,920 | -- |
Source: Public Records
Mortgage History
| Date | Status | Borrower | Loan Amount |
|---|---|---|---|
| Previous Owner | Lowery Catherine Jean | $13,370 | |
| Previous Owner | Lowery Catherine Jean | $53,477 |
Source: Public Records
Tax History
| Year | Tax Paid | Tax Assessment Tax Assessment Total Assessment is a certain percentage of the fair market value that is determined by local assessors to be the total taxable value of land and additions on the property. | Land | Improvement |
|---|---|---|---|---|
| 2025 | $1,077 | $3,732 | $804 | $2,928 |
| 2024 | $1,077 | $3,246 | $810 | $2,436 |
| 2023 | $1,076 | $3,246 | $810 | $2,436 |
| 2022 | $1,072 | $3,246 | $810 | $2,436 |
| 2021 | $1,056 | $3,246 | $810 | $2,436 |
| 2020 | $1,014 | $3,126 | $810 | $2,316 |
| 2019 | $1,058 | $3,126 | $810 | $2,316 |
| 2018 | $1,019 | $3,126 | $810 | $2,316 |
| 2017 | $956 | $0 | $0 | $0 |
| 2016 | $943 | $0 | $0 | $0 |
| 2015 | $866 | $0 | $0 | $0 |
| 2014 | $866 | $0 | $0 | $0 |
| 2013 | $866 | $0 | $0 | $0 |
Source: Public Records
Map
Nearby Homes
- 2509 Oxford Cir
- 2514 Oxford Cir
- 2486 Oxford Cir
- 2488 Cane Mill Rd
- 2570 Pineview Dr
- 0 Watson Dr Unit 39
- 000 Hwy 521 Bypass S
- 2220 Ross Cauthen Rd
- 2425 Kershaw Camden Hwy
- 2157 Ross Cauthen Rd
- 2018 Evans Dr
- 2694 Pineview Dr
- 2429 Bartlett St
- 2644 Downey Dr
- 2040 Athena Rd
- 452 Providence Rd
- 2058 Evans Dr
- 3042 Crenson Dr
- 3038 Crenson Dr
- Lot 24 Avalon Ln Unit 24
- 2072 Bacon St
- 2042 Bacon St
- 2034 Bacon St
- 1946 Monitor Ln
- 1938 Monitor Ln
- 267 Marie Dr
- 251 Marie Dr
- 283 Marie Dr
- 2107 Cane Mill Rd
- 2141 Cane Mill Rd
- 2151 Cane Mill Rd
- 2078 Cane Mill Rd
- 2072 Cane Mill Rd
- 4211 Sienna Ln
- 2095 Cane Mill Rd
- 2126 Cane Mill Rd
- 4206 Sienna Ln
- 2138 Cane Mill Rd
- 2081 Cane Mill Rd
- Lot 25 Hallaway Ln
Your Personal Tour Guide
Ask me questions while you tour the home.