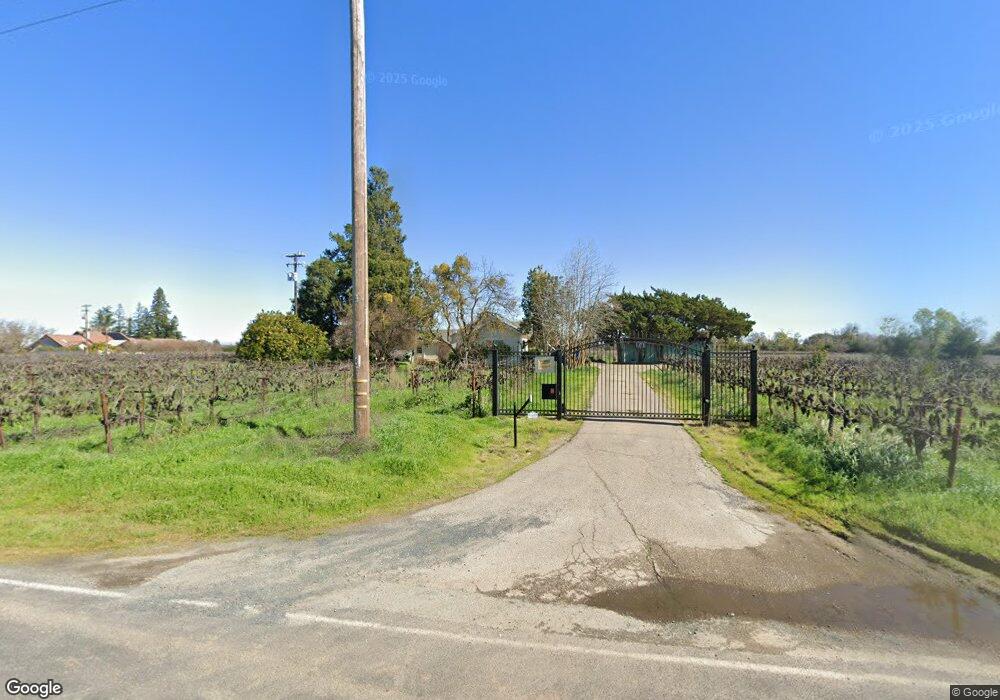
20630 N Tretheway Rd Acampo, CA 95220
Estimated Value: $664,548 - $1,011,000
3
Beds
1
Bath
1,353
Sq Ft
$595/Sq Ft
Est. Value
About This Home
This home is located at 20630 N Tretheway Rd, Acampo, CA 95220 and is currently estimated at $805,183, approximately $595 per square foot. 20630 N Tretheway Rd is a home located in San Joaquin County with nearby schools including Houston School and Lodi High School.
Ownership History
Date
Name
Owned For
Owner Type
Purchase Details
Closed on
Dec 17, 2013
Sold by
Shaw Richard M and Shaw Janet L
Bought by
Somers Karen
Current Estimated Value
Purchase Details
Closed on
Oct 22, 2013
Sold by
Shaw Richard M
Bought by
Shaw Richard M and Shaw Janet L
Purchase Details
Closed on
Jul 11, 2013
Sold by
Gessell Andrea Heath Lounsbery and Severe Andrea Heath
Bought by
Severe Andrea Heath
Purchase Details
Closed on
May 6, 2013
Sold by
Deranleau Charles and Deranleau Melissa Couch
Bought by
Deranleau Melissa Couch
Purchase Details
Closed on
Apr 30, 2013
Sold by
Shaw Janet and Shaw Richard M
Bought by
Shaw Richard M
Purchase Details
Closed on
Mar 2, 2005
Sold by
Shaw Melvin
Bought by
Shaw Melvin
Purchase Details
Closed on
Feb 19, 1998
Sold by
Lounsbery Florence L
Bought by
Shaw Melvin and Shaw Florence L
Create a Home Valuation Report for This Property
The Home Valuation Report is an in-depth analysis detailing your home's value as well as a comparison with similar homes in the area
Home Values in the Area
Average Home Value in this Area
Purchase History
| Date | Buyer | Sale Price | Title Company |
|---|---|---|---|
| Somers Karen | $1,325,000 | Old Republic Title Company | |
| Shaw Richard M | -- | None Available | |
| Severe Andrea Heath | -- | None Available | |
| Deranleau Melissa Couch | -- | None Available | |
| Shaw Richard M | -- | None Available | |
| Shaw Richard M | -- | None Available | |
| Shaw Melvin | -- | -- | |
| Shaw Melvin | -- | -- |
Source: Public Records
Tax History Compared to Growth
Tax History
| Year | Tax Paid | Tax Assessment Tax Assessment Total Assessment is a certain percentage of the fair market value that is determined by local assessors to be the total taxable value of land and additions on the property. | Land | Improvement |
|---|---|---|---|---|
| 2025 | $5,347 | $447,804 | $298,650 | $149,154 |
| 2024 | $5,214 | $439,024 | $292,795 | $146,229 |
| 2023 | $5,044 | $430,417 | $287,054 | $143,363 |
| 2022 | $4,941 | $421,979 | $281,426 | $140,553 |
| 2021 | $4,677 | $413,706 | $275,908 | $137,798 |
| 2020 | $4,557 | $409,465 | $273,079 | $136,386 |
| 2019 | $4,163 | $373,986 | $267,725 | $106,261 |
| 2018 | $3,445 | $307,049 | $242,407 | $64,642 |
| 2017 | $3,369 | $301,029 | $237,654 | $63,375 |
| 2016 | $3,159 | $295,125 | $232,994 | $62,131 |
| 2014 | $3,069 | $285,000 | $225,000 | $60,000 |
Source: Public Records
Map
Nearby Homes
- 19991 N Tretheway Rd
- 21167 N Tretheway Rd
- 6233 E Woodbridge Rd
- 12718 Locke Rd
- 22900 N Sowles Rd
- 9520 E Peltier Rd
- 11153 E Peltier Rd
- 9514 E Peltier Rd
- 9417 E Orchard Rd
- 21428 N Dutchess Ln
- 21324 N Dutchess Ln
- 21376 N Dutchess Ln
- 11900 E Brandt Rd
- 18450 N Highway 88 Unit 7A
- 8275 E Orchard Rd Unit E
- 18385 Milford Dr
- 14537 Miravista Ln
- 23031 N Bruella Rd
- 14334 E Prospect Place
- 17251 N Tretheway Rd Unit 7
- 20600 N Tretheway Rd
- 11370 E Foster Rd
- 11665 E Foster Rd
- 20550 N Tretheway Rd
- 23955 N Tretheway Rd
- 5 N Tretheway Rd
- 23863 N Tretheway Rd
- 21090 N Tretheway Rd
- 20250 N Tretheway Rd
- 21199 N Tretheway Rd
- 11610 E Acampo Rd
- 10778 E Acampo Rd
- 10702 E Acampo Rd
- 11501 E Acampo Rd
- 11890 E Acampo Rd
- 10700 E Acampo Rd
- 12078 E Acampo Rd
- 12080 E Acampo Rd
- 21421 Ward Rd
- 10899 E Woodbridge Rd