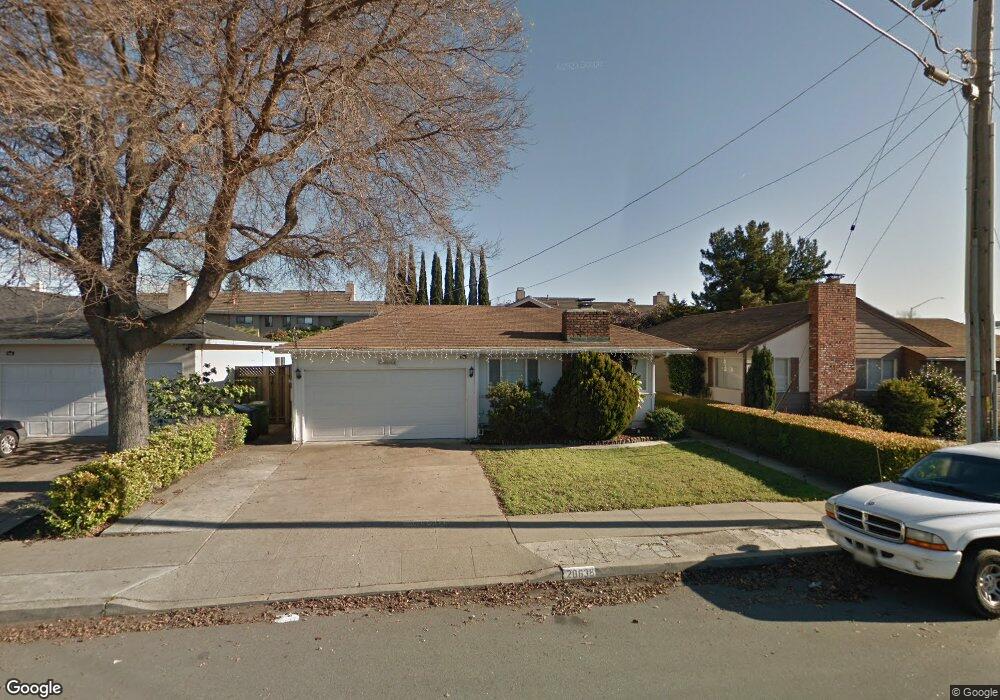
20638 Yeandle Ave Castro Valley, CA 94546
Castro Valley East NeighborhoodEstimated Value: $976,000 - $1,105,000
3
Beds
2
Baths
1,292
Sq Ft
$782/Sq Ft
Est. Value
About This Home
This home is located at 20638 Yeandle Ave, Castro Valley, CA 94546 and is currently estimated at $1,010,661, approximately $782 per square foot. 20638 Yeandle Ave is a home located in Alameda County with nearby schools including Marshall Elementary School, Creekside Middle School, and Canyon Middle School.
Ownership History
Date
Name
Owned For
Owner Type
Purchase Details
Closed on
Jul 12, 2018
Sold by
Eckert Robert R and Clark Trust
Bought by
Eckert Sean B and Papageorge Roseann
Current Estimated Value
Home Financials for this Owner
Home Financials are based on the most recent Mortgage that was taken out on this home.
Original Mortgage
$400,000
Outstanding Balance
$346,660
Interest Rate
4.5%
Mortgage Type
New Conventional
Estimated Equity
$664,001
Purchase Details
Closed on
Feb 25, 2003
Sold by
Rico Marco Antonio S and Santos Rico Elvira
Bought by
Clark Leslie and Clark Trust
Purchase Details
Closed on
Oct 18, 2000
Sold by
Costa John L and Costa Joyce M
Bought by
Rico Marco Antonio S and Santos Rico Elvira
Home Financials for this Owner
Home Financials are based on the most recent Mortgage that was taken out on this home.
Original Mortgage
$307,325
Interest Rate
7.89%
Create a Home Valuation Report for This Property
The Home Valuation Report is an in-depth analysis detailing your home's value as well as a comparison with similar homes in the area
Home Values in the Area
Average Home Value in this Area
Purchase History
| Date | Buyer | Sale Price | Title Company |
|---|---|---|---|
| Eckert Sean B | $600,000 | Stewart Title Of California | |
| Clark Leslie | $425,000 | Old Republic Title Company | |
| Rico Marco Antonio S | $323,500 | Chicago Title Co |
Source: Public Records
Mortgage History
| Date | Status | Borrower | Loan Amount |
|---|---|---|---|
| Open | Eckert Sean B | $400,000 | |
| Previous Owner | Rico Marco Antonio S | $307,325 |
Source: Public Records
Tax History Compared to Growth
Tax History
| Year | Tax Paid | Tax Assessment Tax Assessment Total Assessment is a certain percentage of the fair market value that is determined by local assessors to be the total taxable value of land and additions on the property. | Land | Improvement |
|---|---|---|---|---|
| 2025 | $8,571 | $669,300 | $200,790 | $468,510 |
| 2024 | $8,571 | $656,177 | $196,853 | $459,324 |
| 2023 | $8,432 | $643,313 | $192,994 | $450,319 |
| 2022 | $8,269 | $630,701 | $189,210 | $441,491 |
| 2021 | $8,058 | $618,335 | $185,500 | $432,835 |
| 2020 | $7,874 | $612,000 | $183,600 | $428,400 |
| 2019 | $8,018 | $600,000 | $180,000 | $420,000 |
| 2018 | $7,137 | $540,947 | $162,284 | $378,663 |
| 2017 | $6,948 | $530,344 | $159,103 | $371,241 |
| 2016 | $6,611 | $519,948 | $155,984 | $363,964 |
| 2015 | $6,179 | $512,141 | $153,642 | $358,499 |
| 2014 | $6,101 | $502,111 | $150,633 | $351,478 |
Source: Public Records
Map
Nearby Homes
- 3767 Castro Valley Blvd
- 3769 Castro Valley Blvd
- 3775 Castro Valley Blvd
- 3824 Norbridge Ave
- 3710 Scribe Way
- Plan 1714 at The Chapter
- Plan 1582 at The Chapter
- Plan 1660 at The Chapter
- Plan 1606 at The Chapter
- Plan 1495 at The Chapter
- Plan 1705 at The Chapter
- Plan 1423 Modeled at The Chapter
- Plan 1749 Modeled at The Chapter
- 21061 Story St
- 3826 Norbridge Ave
- 3838 Norbridge Ave
- 3913 Castro Valley Blvd Unit 39
- 3414 Pine St
- 3998 Castro Valley Blvd Unit 34
- 3998 Castro Valley Blvd Unit SPC 27
- 20650 Yeandle Ave
- 20626 Yeandle Ave
- 20663 Maria Ct
- 20667 Maria Ct
- 20659 Maria Ct
- 20671 Maria Ct
- 20614 Yeandle Ave
- 20655 Maria Ct
- 20675 Maria Ct
- 20647 Maria Ct
- 20637 Yeandle Ave
- 20649 Yeandle Ave
- 20651 Maria Ct
- 20589 Yeandle Ave
- 20602 Yeandle Ave
- 20676 Maria Ct
- 3726 Castro Valley Blvd
- 20590 Yeandle Ave
- 20643 Maria Ct
- 20672 Maria Ct