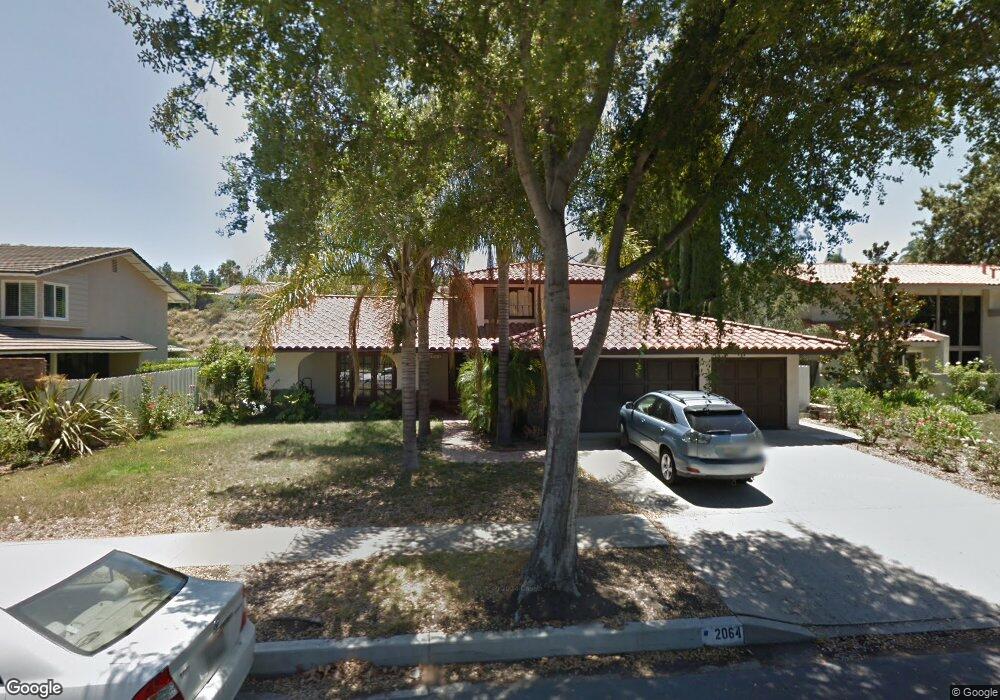
2064 Bridgegate Ct Westlake Village, CA 91361
Estimated Value: $1,428,000 - $1,614,000
4
Beds
2
Baths
2,305
Sq Ft
$662/Sq Ft
Est. Value
About This Home
This home is located at 2064 Bridgegate Ct, Westlake Village, CA 91361 and is currently estimated at $1,524,895, approximately $661 per square foot. 2064 Bridgegate Ct is a home located in Ventura County with nearby schools including Westlake Elementary School, Colina Middle School, and Westlake High School.
Ownership History
Date
Name
Owned For
Owner Type
Purchase Details
Closed on
Jan 24, 2000
Sold by
Graber Gary H
Bought by
Zou Hehong and Chen Li
Current Estimated Value
Home Financials for this Owner
Home Financials are based on the most recent Mortgage that was taken out on this home.
Original Mortgage
$332,000
Outstanding Balance
$104,771
Interest Rate
7.75%
Mortgage Type
Purchase Money Mortgage
Estimated Equity
$1,420,124
Purchase Details
Closed on
Feb 7, 1997
Sold by
Faller Raymond J and Faller Norma A
Bought by
Graber Gary H and Graber Tara C
Home Financials for this Owner
Home Financials are based on the most recent Mortgage that was taken out on this home.
Original Mortgage
$240,000
Interest Rate
3.95%
Mortgage Type
Purchase Money Mortgage
Purchase Details
Closed on
Jul 15, 1996
Sold by
Faller Raymond J and Faller Norma A
Bought by
Faller Raymond J and Faller Norma A
Create a Home Valuation Report for This Property
The Home Valuation Report is an in-depth analysis detailing your home's value as well as a comparison with similar homes in the area
Home Values in the Area
Average Home Value in this Area
Purchase History
| Date | Buyer | Sale Price | Title Company |
|---|---|---|---|
| Zou Hehong | $415,000 | Lawyers Title Company | |
| Graber Gary H | $300,000 | Fidelity National Title | |
| Faller Raymond J | -- | -- |
Source: Public Records
Mortgage History
| Date | Status | Borrower | Loan Amount |
|---|---|---|---|
| Open | Zou Hehong | $332,000 | |
| Previous Owner | Graber Gary H | $240,000 |
Source: Public Records
Tax History Compared to Growth
Tax History
| Year | Tax Paid | Tax Assessment Tax Assessment Total Assessment is a certain percentage of the fair market value that is determined by local assessors to be the total taxable value of land and additions on the property. | Land | Improvement |
|---|---|---|---|---|
| 2025 | $8,134 | $637,813 | $255,124 | $382,689 |
| 2024 | $8,134 | $625,307 | $250,121 | $375,186 |
| 2023 | $7,874 | $613,047 | $245,217 | $367,830 |
| 2022 | $7,589 | $601,027 | $240,409 | $360,618 |
| 2021 | $7,329 | $589,243 | $235,695 | $353,548 |
| 2020 | $7,119 | $583,203 | $233,279 | $349,924 |
| 2019 | $6,844 | $571,768 | $228,705 | $343,063 |
| 2018 | $6,659 | $560,558 | $224,221 | $336,337 |
| 2017 | $6,485 | $549,568 | $219,825 | $329,743 |
| 2016 | $6,389 | $538,793 | $215,515 | $323,278 |
| 2015 | $6,249 | $530,702 | $212,279 | $318,423 |
| 2014 | -- | $520,309 | $208,122 | $312,187 |
Source: Public Records
Map
Nearby Homes
- 2039 Channelford Rd
- 1161 Triunfo Canyon Rd
- 2270 Portola Ln
- 1440 Cheswick Place
- 1228 S Westlake Blvd Unit B
- 1222 S Westlake Blvd Unit B
- 1248 Clippers Cir Unit 51
- 1176 S Westlake Blvd
- 1218 S Westlake Blvd Unit A
- 1589 Brentford Ave
- 1174 S Westlake Blvd Unit C
- 1206 S Westlake Blvd Unit D
- 1206 S Westlake Blvd Unit E
- 1042 Barrow Ct
- 1023 Barrow Ct
- 1275 Westwind Cir
- 1321 Bluesail Cir
- 1885 Fallview Rd
- 2052 Bridgegate Ct
- 2076 Bridgegate Ct
- 2040 Bridgegate Ct
- 2088 Bridgegate Ct
- 1344 Woodlow Ct
- 2047 Bridgegate Ct
- 2048 Creekwood St
- 2094 Bridgegate Ct
- 2038 Bridgegate Ct
- 2039 Bridgegate Ct
- 1338 Woodlow Ct
- 2075 Channelford Rd
- 2063 Channelford Rd
- 1326 Woodlow Ct
- 2102 Bridgegate Ct
- 2066 Creekwood St
- 2081 Channelford Rd
- 1345 Woodlow Ct
- 2093 Bridgegate Ct
- 1345 Glenmare Ct