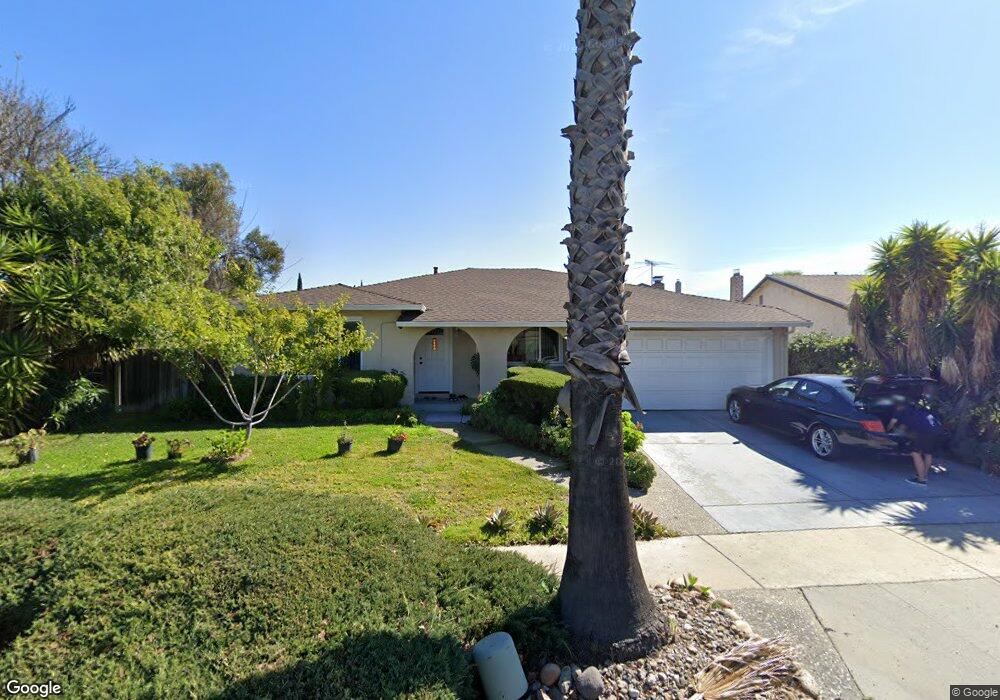
2064 Ensign Way San Jose, CA 95133
Commodore NeighborhoodEstimated Value: $1,573,694 - $1,806,000
4
Beds
2
Baths
2,084
Sq Ft
$819/Sq Ft
Est. Value
About This Home
This home is located at 2064 Ensign Way, San Jose, CA 95133 and is currently estimated at $1,707,174, approximately $819 per square foot. 2064 Ensign Way is a home located in Santa Clara County with nearby schools including Vinci Park Elementary School, Piedmont Middle School, and Independence High School.
Ownership History
Date
Name
Owned For
Owner Type
Purchase Details
Closed on
Mar 16, 2020
Sold by
Lee Manlan
Bought by
Lee Manlan and Manlan Lee Revocable Trust
Current Estimated Value
Purchase Details
Closed on
Jun 1, 2011
Sold by
Dragonfly Investments Lp #109
Bought by
Lee Man Lan
Home Financials for this Owner
Home Financials are based on the most recent Mortgage that was taken out on this home.
Original Mortgage
$251,000
Outstanding Balance
$164,610
Interest Rate
3.62%
Mortgage Type
Adjustable Rate Mortgage/ARM
Estimated Equity
$1,542,564
Purchase Details
Closed on
Mar 30, 2011
Sold by
Hernandez Edward B G and Hernandez Lupe S
Bought by
Dragonfly Investments Lp #109
Create a Home Valuation Report for This Property
The Home Valuation Report is an in-depth analysis detailing your home's value as well as a comparison with similar homes in the area
Home Values in the Area
Average Home Value in this Area
Purchase History
| Date | Buyer | Sale Price | Title Company |
|---|---|---|---|
| Lee Manlan | -- | None Available | |
| Lee Man Lan | $511,000 | Chicago Title Company | |
| Dragonfly Investments Lp #109 | $441,000 | Cr Title Services Inc |
Source: Public Records
Mortgage History
| Date | Status | Borrower | Loan Amount |
|---|---|---|---|
| Open | Lee Man Lan | $251,000 |
Source: Public Records
Tax History
| Year | Tax Paid | Tax Assessment Tax Assessment Total Assessment is a certain percentage of the fair market value that is determined by local assessors to be the total taxable value of land and additions on the property. | Land | Improvement |
|---|---|---|---|---|
| 2025 | $9,551 | $654,353 | $392,550 | $261,803 |
| 2024 | $9,551 | $641,523 | $384,853 | $256,670 |
| 2023 | $9,372 | $628,945 | $377,307 | $251,638 |
| 2022 | $9,420 | $616,613 | $369,909 | $246,704 |
| 2021 | $9,023 | $604,523 | $362,656 | $241,867 |
| 2020 | $8,740 | $598,325 | $358,938 | $239,387 |
| 2019 | $8,405 | $586,594 | $351,900 | $234,694 |
| 2018 | $8,283 | $575,093 | $345,000 | $230,093 |
| 2017 | $8,327 | $563,818 | $338,236 | $225,582 |
| 2016 | $7,980 | $552,763 | $331,604 | $221,159 |
| 2015 | $7,885 | $544,460 | $326,623 | $217,837 |
| 2014 | $7,208 | $533,795 | $320,225 | $213,570 |
Source: Public Records
Map
Nearby Homes
- 2083 Bluejacket Way
- 2043 Shellback Place
- 1136 Ribisi Cir
- 1135 Pandolfi Place
- 1034 Ribisi Cir
- 2194 Celeste Ct
- 1252 Turrett Dr
- 2505 Dillion Ct Unit 3
- 1062 Rymar Place
- 2381 Lava Dr
- 2465 Sequester Ct
- 1729 Maysong Ct
- 1055 N Capitol Ave Unit 167
- 1055 N Capitol Ave Unit 180
- 879 Wyman Way Unit 2
- 12280 Mabury Rd
- 1131 Chen St
- 783 Opie Ct
- 1368 Goldenlake Rd
- 1146 Rosebriar Way
- 2056 Ensign Way
- 2079 Admiral Place
- 2071 Admiral Place
- 2048 Ensign Way
- 2063 Admiral Place
- 2087 Admiral Place
- 2065 Ensign Way
- 2055 Admiral Place
- 2011 Pepper Way
- 2040 Ensign Way
- 1082 N Jackson Ave
- 1066 N Jackson Ave
- 1076 N Jackson Ave
- 1080 N Jackson Ave
- 2049 Ensign Way
- 1090 N Jackson Ave
- 1062 N Jackson Ave
- 1086 N Jackson Ave Unit 4
- 2047 Admiral Place
- 2086 Admiral Place
Your Personal Tour Guide
Ask me questions while you tour the home.