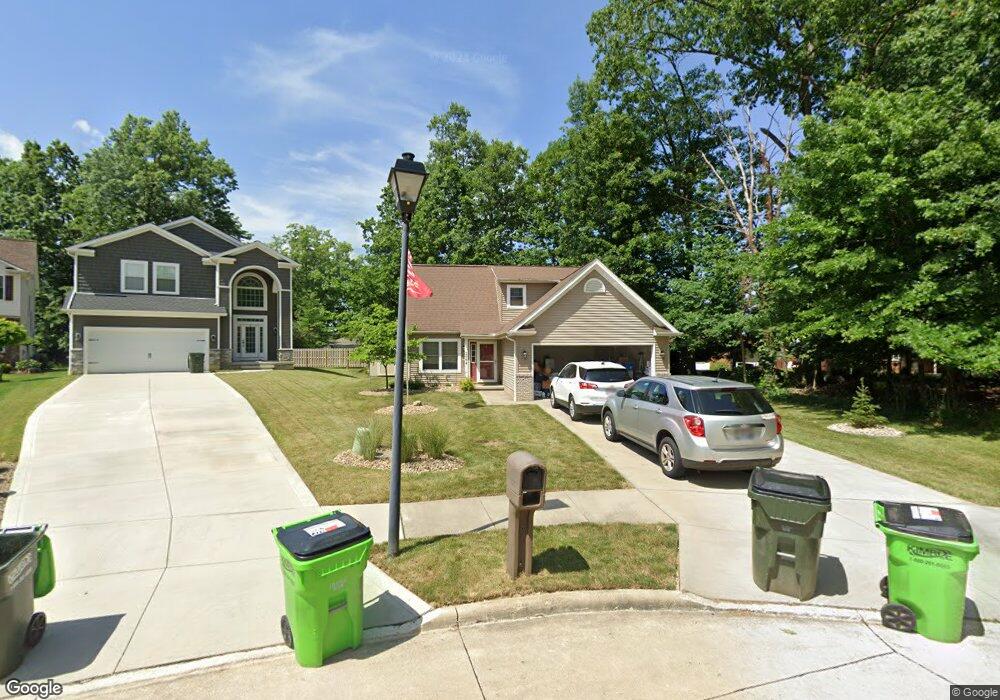
2064 Lloyd Ct Wickliffe, OH 44092
Estimated Value: $231,935 - $245,000
2
Beds
2
Baths
984
Sq Ft
$244/Sq Ft
Est. Value
About This Home
This home is located at 2064 Lloyd Ct, Wickliffe, OH 44092 and is currently estimated at $239,984, approximately $243 per square foot. 2064 Lloyd Ct is a home with nearby schools including Wickliffe Elementary School, Wickliffe Middle School, and Wickliffe High School.
Ownership History
Date
Name
Owned For
Owner Type
Purchase Details
Closed on
Jan 6, 2022
Sold by
Dickinson Michele S
Bought by
Dickinson Michele S and Dickinson Norman R
Current Estimated Value
Purchase Details
Closed on
Mar 21, 2011
Sold by
Archangel Land Development Company
Bought by
Dickenson Michele S
Home Financials for this Owner
Home Financials are based on the most recent Mortgage that was taken out on this home.
Original Mortgage
$194,930
Outstanding Balance
$136,901
Interest Rate
5.5%
Mortgage Type
FHA
Estimated Equity
$103,083
Purchase Details
Closed on
Mar 29, 2010
Sold by
Best Value & Quality Inc
Bought by
Archangel Land Development Company Inc
Purchase Details
Closed on
Feb 25, 2010
Sold by
Archangel Land Development Company Inc
Bought by
Best Value & Quality Inc
Create a Home Valuation Report for This Property
The Home Valuation Report is an in-depth analysis detailing your home's value as well as a comparison with similar homes in the area
Home Values in the Area
Average Home Value in this Area
Purchase History
| Date | Buyer | Sale Price | Title Company |
|---|---|---|---|
| Dickinson Michele S | -- | None Available | |
| Dickenson Michele S | $206,000 | Attorney | |
| Archangel Land Development Company Inc | -- | None Available | |
| Best Value & Quality Inc | -- | Attorney |
Source: Public Records
Mortgage History
| Date | Status | Borrower | Loan Amount |
|---|---|---|---|
| Open | Dickenson Michele S | $194,930 |
Source: Public Records
Tax History
| Year | Tax Paid | Tax Assessment Tax Assessment Total Assessment is a certain percentage of the fair market value that is determined by local assessors to be the total taxable value of land and additions on the property. | Land | Improvement |
|---|---|---|---|---|
| 2025 | -- | $80,710 | $18,020 | $62,690 |
| 2024 | -- | $80,710 | $18,020 | $62,690 |
| 2023 | $3,939 | $69,190 | $15,270 | $53,920 |
| 2022 | $4,005 | $73,040 | $15,270 | $57,770 |
| 2021 | $3,120 | $73,040 | $15,270 | $57,770 |
| 2020 | $5,353 | $59,870 | $12,520 | $47,350 |
| 2019 | $5,403 | $59,870 | $12,520 | $47,350 |
| 2018 | $6,405 | $67,170 | $19,650 | $47,520 |
| 2017 | $6,425 | $67,170 | $19,650 | $47,520 |
| 2016 | $5,023 | $67,170 | $19,650 | $47,520 |
| 2015 | $4,621 | $67,170 | $19,650 | $47,520 |
| 2014 | $4,070 | $67,170 | $19,650 | $47,520 |
| 2013 | $4,068 | $67,170 | $19,650 | $47,520 |
Source: Public Records
Map
Nearby Homes
- 29107 Fuller Ave
- 29136 Norman Ave
- 568 Sycamore Dr
- 597 Hemlock Dr
- 625 Lloyd Rd
- 670 Hemlock Dr
- 428 E 274th St
- 730 Hemlock Dr
- 406 E 274th St
- 411 E 270th St
- 29616 Grand Blvd
- 754 Hemlock Dr
- 26831 Shoreview Ave
- 940 Talmadge Ave
- 610 E 266th St
- 26530 Shoreview Ave
- 218 Wells Ct
- 298 E 270th St
- 295 E 276th St
- 325 E 264th St
Your Personal Tour Guide
Ask me questions while you tour the home.