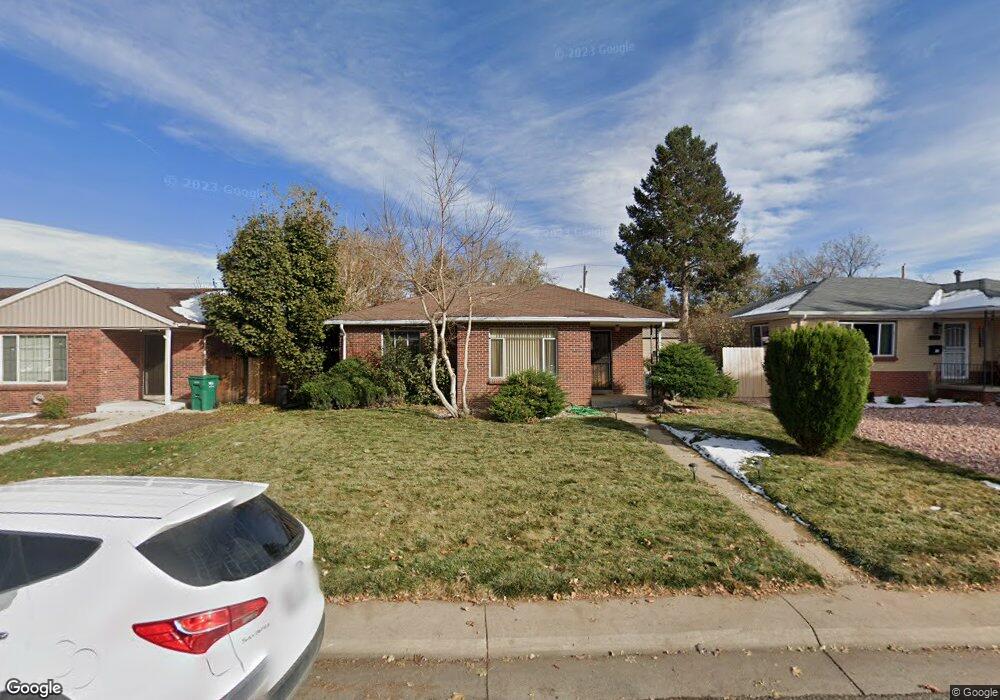
2064 Moline St Aurora, CO 80010
North Aurora NeighborhoodEstimated Value: $351,000 - $394,119
2
Beds
1
Bath
945
Sq Ft
$397/Sq Ft
Est. Value
About This Home
This home is located at 2064 Moline St, Aurora, CO 80010 and is currently estimated at $375,530, approximately $397 per square foot. 2064 Moline St is a home located in Adams County with nearby schools including Montview Elementary School, North Middle School Health Sciences & Technology, and Aurora Central High School.
Ownership History
Date
Name
Owned For
Owner Type
Purchase Details
Closed on
Oct 4, 2002
Sold by
Rausch Lisa Thi
Bought by
Harris Patrick J and Harris Kimberly J
Current Estimated Value
Home Financials for this Owner
Home Financials are based on the most recent Mortgage that was taken out on this home.
Original Mortgage
$121,500
Outstanding Balance
$49,370
Interest Rate
6.26%
Estimated Equity
$326,160
Purchase Details
Closed on
Oct 29, 1998
Sold by
Harris Verne V
Bought by
Rausch Lisa Thi
Home Financials for this Owner
Home Financials are based on the most recent Mortgage that was taken out on this home.
Original Mortgage
$114,560
Interest Rate
6.57%
Mortgage Type
FHA
Create a Home Valuation Report for This Property
The Home Valuation Report is an in-depth analysis detailing your home's value as well as a comparison with similar homes in the area
Home Values in the Area
Average Home Value in this Area
Purchase History
| Date | Buyer | Sale Price | Title Company |
|---|---|---|---|
| Harris Patrick J | $135,000 | -- | |
| Rausch Lisa Thi | $115,500 | -- |
Source: Public Records
Mortgage History
| Date | Status | Borrower | Loan Amount |
|---|---|---|---|
| Open | Harris Patrick J | $121,500 | |
| Previous Owner | Rausch Lisa Thi | $114,560 |
Source: Public Records
Tax History
| Year | Tax Paid | Tax Assessment Tax Assessment Total Assessment is a certain percentage of the fair market value that is determined by local assessors to be the total taxable value of land and additions on the property. | Land | Improvement |
|---|---|---|---|---|
| 2025 | $2,405 | $25,840 | $5,440 | $20,400 |
| 2024 | $2,405 | $23,750 | $5,000 | $18,750 |
| 2023 | $2,443 | $26,660 | $5,210 | $21,450 |
| 2022 | $2,513 | $22,120 | $5,350 | $16,770 |
| 2021 | $2,619 | $22,120 | $5,350 | $16,770 |
| 2020 | $2,758 | $23,370 | $5,510 | $17,860 |
| 2019 | $2,753 | $23,370 | $5,510 | $17,860 |
| 2018 | $2,114 | $17,870 | $4,320 | $13,550 |
| 2017 | $1,878 | $17,870 | $4,320 | $13,550 |
| 2016 | $1,345 | $12,690 | $2,470 | $10,220 |
| 2015 | $1,303 | $12,690 | $2,470 | $10,220 |
| 2014 | -- | $10,010 | $1,830 | $8,180 |
Source: Public Records
Map
Nearby Homes
- 2040 Moline St
- 1990 Newark St
- 2045 Lima St
- 1772 Moline St
- 1764 Newark St
- 1781 N Oakland St
- 2381 Nome St
- 11087 E Montview Blvd
- 11087 Montview Blvd
- 2521 Moline St
- 1942 Kenton St
- 1764 Oswego St
- 1680 Newark St
- 1902 Kenton St
- 11185 E 25th Ave
- 11589 E 25th Dr
- 11248 E 25th Dr
- 1665 Lima St
- 1671 Oswego St
- 2350 Joliet St