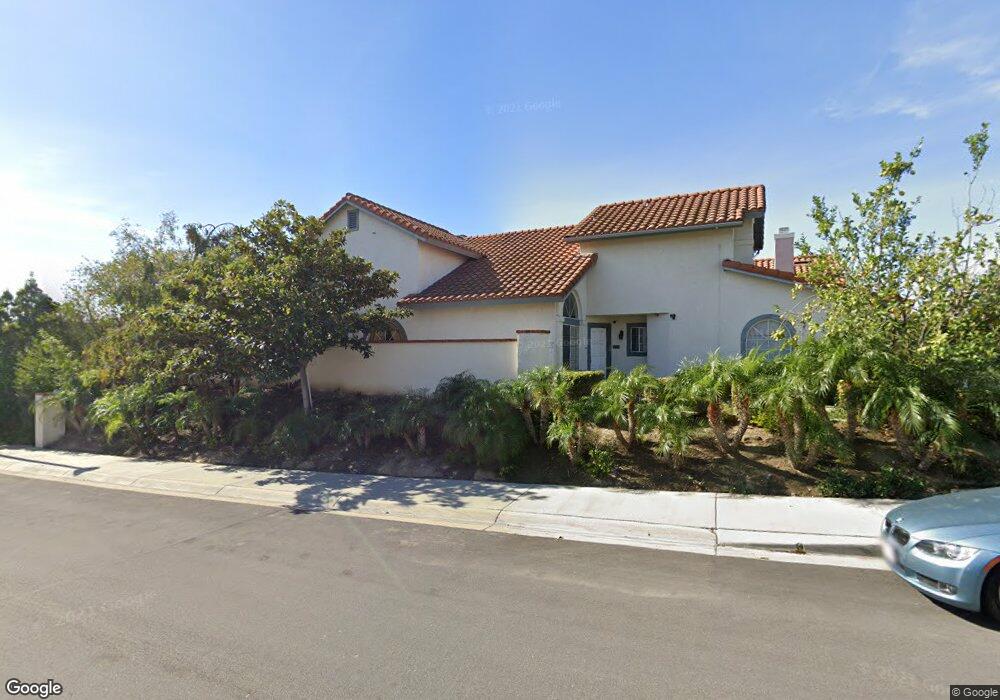
20640 Via Susannah Yorba Linda, CA 92887
Estimated Value: $1,300,000 - $1,538,000
4
Beds
3
Baths
2,286
Sq Ft
$628/Sq Ft
Est. Value
About This Home
This home is located at 20640 Via Susannah, Yorba Linda, CA 92887 and is currently estimated at $1,434,517, approximately $627 per square foot. 20640 Via Susannah is a home located in Orange County with nearby schools including Glenknoll Elementary, Bernardo Yorba Middle School, and Ivycrest Montessori Private School - Yorba Linda.
Ownership History
Date
Name
Owned For
Owner Type
Purchase Details
Closed on
Nov 16, 2022
Sold by
Kabab Laila
Bought by
Midani-Kabab Livingtrust
Current Estimated Value
Purchase Details
Closed on
Sep 19, 2000
Sold by
Midani Marwan Robert
Bought by
Kabab Laila
Purchase Details
Closed on
Aug 23, 2000
Sold by
Ossima Hussri
Bought by
Kabab Laila
Purchase Details
Closed on
Jan 26, 1999
Sold by
Kabab Joseph
Bought by
Hussri Ossima
Home Financials for this Owner
Home Financials are based on the most recent Mortgage that was taken out on this home.
Original Mortgage
$256,800
Interest Rate
6.73%
Mortgage Type
Stand Alone First
Purchase Details
Closed on
Jul 31, 1998
Sold by
Nolen Montgomery Robert and Marshell Montgomery Marshell
Bought by
First Federal Bank Of California
Create a Home Valuation Report for This Property
The Home Valuation Report is an in-depth analysis detailing your home's value as well as a comparison with similar homes in the area
Home Values in the Area
Average Home Value in this Area
Purchase History
| Date | Buyer | Sale Price | Title Company |
|---|---|---|---|
| Midani-Kabab Livingtrust | -- | -- | |
| Kabab Laila | -- | Southland Title Corporation | |
| Kabab Laila | $260,000 | Southland Title Corporation | |
| Hussri Ossima | -- | -- | |
| Hussri Ossima | $321,000 | Stewart Title | |
| First Federal Bank Of California | $317,727 | American Title Co |
Source: Public Records
Mortgage History
| Date | Status | Borrower | Loan Amount |
|---|---|---|---|
| Previous Owner | Hussri Ossima | $256,800 |
Source: Public Records
Tax History Compared to Growth
Tax History
| Year | Tax Paid | Tax Assessment Tax Assessment Total Assessment is a certain percentage of the fair market value that is determined by local assessors to be the total taxable value of land and additions on the property. | Land | Improvement |
|---|---|---|---|---|
| 2025 | $6,719 | $542,451 | $254,461 | $287,990 |
| 2024 | $6,719 | $531,815 | $249,471 | $282,344 |
| 2023 | $6,588 | $521,388 | $244,580 | $276,808 |
| 2022 | $6,494 | $511,165 | $239,784 | $271,381 |
| 2021 | $6,369 | $501,143 | $235,083 | $266,060 |
| 2020 | $6,262 | $496,005 | $232,673 | $263,332 |
| 2019 | $6,015 | $486,280 | $228,111 | $258,169 |
| 2018 | $5,963 | $476,746 | $223,639 | $253,107 |
| 2017 | $5,864 | $467,399 | $219,254 | $248,145 |
| 2016 | $5,747 | $458,235 | $214,955 | $243,280 |
| 2015 | $5,672 | $451,352 | $211,726 | $239,626 |
| 2014 | $5,511 | $442,511 | $207,578 | $234,933 |
Source: Public Records
Map
Nearby Homes
- 5505 Calle Vista Linda
- 20455 Via Cadiz
- 20770 Paseo de la Rambla
- 20520 Via Magdalena
- 5795 Via Perla
- 6191 Jacaranda Ln
- 5851 Via Santana
- 5289 Via Andalusia
- 20754 Tulip Cir
- 5317 Via Ramon Rd
- 1265 N Andrea Ln
- 5810 34 Via Romero
- 6180 Via Nietos
- 20709 Calle Pera
- 5244 Via Ramon Rd
- 7880 E Samantha Cir
- 20660 Calle Feliz
- 1290 N Tippetts Ln
- 1221 N Foxton Cir
- 20180 Pingree Way
- 20630 Via Susannah
- 20620 Via Susannah
- 20645 Via Bilbao
- 20635 Via Bilbao
- 5490 Avenida el Cid
- 5480 Avenida el Cid
- 20625 Via Bilbao
- 5500 Avenida el Cid
- 5470 Avenida el Cid
- 20645 Via Susannah
- 20635 Via Susannah
- 20610 Via Susannah
- 5510 Avenida el Cid
- 5460 Avenida el Cid
- 20625 Via Susannah
- 5520 Avenida el Cid
- 5450 Avenida el Cid
- 20615 Via Susannah
- 5530 Avenida el Cid
- 5495 Via Cervantes