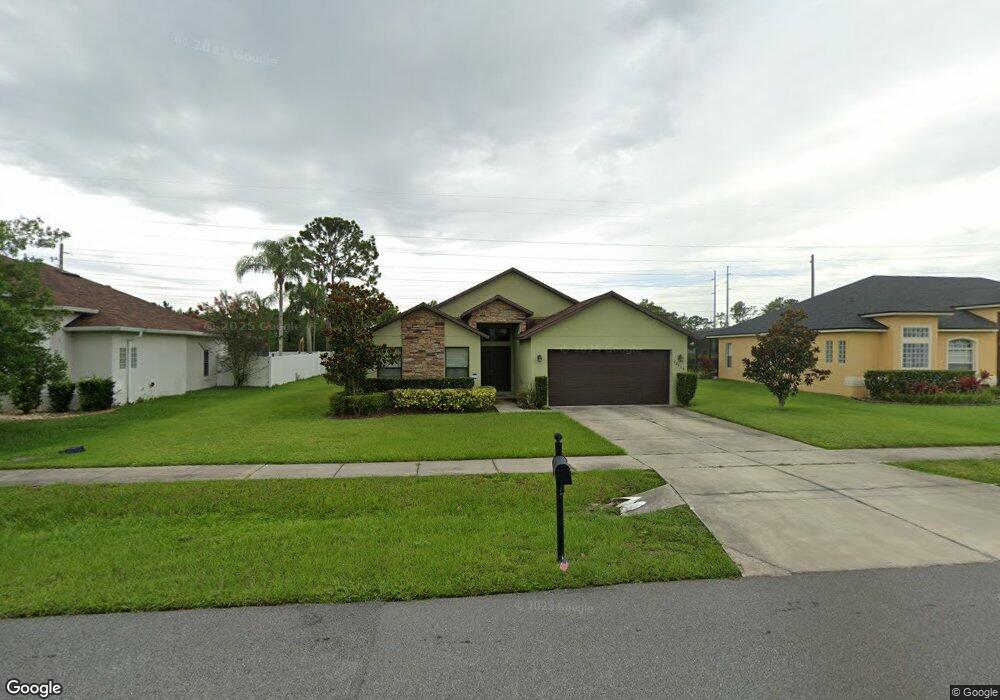
20658 Nettleton St Orlando, FL 32833
Estimated Value: $457,529 - $531,000
4
Beds
2
Baths
2,208
Sq Ft
$228/Sq Ft
Est. Value
About This Home
This home is located at 20658 Nettleton St, Orlando, FL 32833 and is currently estimated at $504,132, approximately $228 per square foot. 20658 Nettleton St is a home located in Orange County with nearby schools including Wedgefield School, East River High School, and Orange County Academy.
Ownership History
Date
Name
Owned For
Owner Type
Purchase Details
Closed on
Jun 22, 2022
Sold by
Althaus Kevin E
Bought by
Althaus Kevin E
Current Estimated Value
Purchase Details
Closed on
Jan 16, 2015
Sold by
Spc Homes Inc
Bought by
Althaus Kevin E
Home Financials for this Owner
Home Financials are based on the most recent Mortgage that was taken out on this home.
Original Mortgage
$247,920
Interest Rate
3.88%
Mortgage Type
VA
Purchase Details
Closed on
Jun 20, 2014
Sold by
Reyes Edelberto and Reyes Peregrina
Bought by
Spc Homes Inc
Home Financials for this Owner
Home Financials are based on the most recent Mortgage that was taken out on this home.
Original Mortgage
$150,000
Interest Rate
4.17%
Mortgage Type
Unknown
Purchase Details
Closed on
Oct 7, 2002
Sold by
Magna Community Dev Corp
Bought by
Reyes Edelberto and Reyes Peregrina C
Create a Home Valuation Report for This Property
The Home Valuation Report is an in-depth analysis detailing your home's value as well as a comparison with similar homes in the area
Home Values in the Area
Average Home Value in this Area
Purchase History
| Date | Buyer | Sale Price | Title Company |
|---|---|---|---|
| Althaus Kevin E | -- | None Listed On Document | |
| Althaus Kevin E | $244,997 | Cobblestone Title Svcs Llc | |
| Spc Homes Inc | $17,500 | Cobblestone Title Service | |
| Reyes Edelberto | $18,000 | -- |
Source: Public Records
Mortgage History
| Date | Status | Borrower | Loan Amount |
|---|---|---|---|
| Previous Owner | Althaus Kevin E | $247,920 | |
| Previous Owner | Spc Homes Inc | $150,000 |
Source: Public Records
Tax History Compared to Growth
Tax History
| Year | Tax Paid | Tax Assessment Tax Assessment Total Assessment is a certain percentage of the fair market value that is determined by local assessors to be the total taxable value of land and additions on the property. | Land | Improvement |
|---|---|---|---|---|
| 2025 | $3,827 | $264,651 | -- | -- |
| 2024 | $3,558 | $257,192 | -- | -- |
| 2023 | $3,558 | $242,664 | $0 | $0 |
| 2022 | $3,430 | $235,596 | $0 | $0 |
| 2021 | $3,357 | $228,734 | $0 | $0 |
| 2020 | $3,195 | $225,576 | $0 | $0 |
| 2019 | $3,285 | $220,504 | $0 | $0 |
| 2018 | $3,257 | $216,393 | $0 | $0 |
| 2017 | $3,217 | $215,066 | $16,500 | $198,566 |
| 2016 | $3,188 | $207,583 | $15,000 | $192,583 |
| 2015 | $575 | $15,000 | $15,000 | $0 |
| 2014 | $383 | $16,000 | $16,000 | $0 |
Source: Public Records
Map
Nearby Homes
- 20607 Newby St
- 2649 Albion Ave
- 2797 Babbitt Ave
- 2548 Albion Ave
- 0 Babbitt Ave Unit MFRO6352786
- 20610 Maxim Pkwy
- 3228 Abalone Blvd
- 20423 Melville St Unit 4
- 2827 Ballard Ave
- 0 Nettleton St Unit MFRO6367829
- 2350 Ardon Ave
- 2336 Ardon Ave Unit 4
- 0 Netherland St Unit MFRO6314289
- 20241 Maxim Pkwy Unit 4
- 2601 Pine Glen Ct
- 2881 Lyndscape St
- 20730 Mallard Pkwy
- 2233 Ardon Ave
- 2809 Lyndscape St
- 19603 Glen Elm Way
- 20674 Nettleton St
- 20654 Nettleton St
- 20680 Nettleton St
- 20673 Nettleton St
- 20655 Nettleton St
- 20686 Nettleton St Unit 4
- 20625 Nettleton St
- 2817 Albion Ave
- 20619 Nettleton St
- 20634 Nettleton St
- 20634 Netherland St
- 2809 Albion Ave
- 20626 Netherland St
- 2801 Albion Ave
- 20618 Netherland St
- 20706 Nettleton St
- 20610 Netherland St
- 20591 Nettleton St
- 20655 Netherland St
- 20661 Netherland St