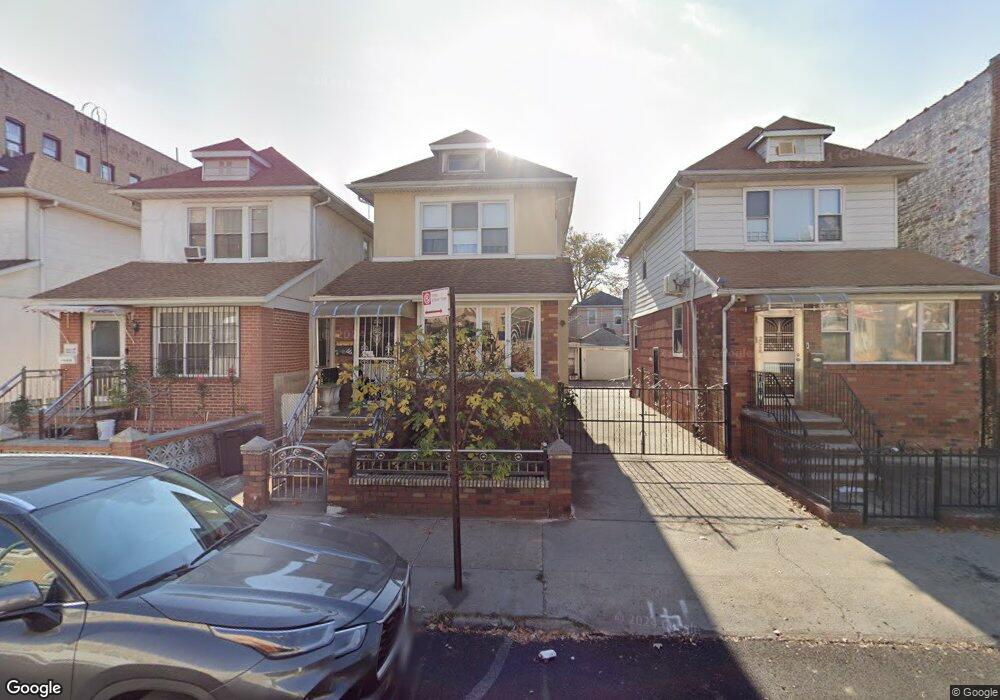
2066 78th St Brooklyn, NY 11214
Bensonhurst NeighborhoodEstimated Value: $963,405 - $1,235,000
--
Bed
--
Bath
1,240
Sq Ft
$904/Sq Ft
Est. Value
About This Home
This home is located at 2066 78th St, Brooklyn, NY 11214 and is currently estimated at $1,120,351, approximately $903 per square foot. 2066 78th St is a home located in Kings County with nearby schools including P.S. 186 Dr. Irving A. Gladstone Elementary School, Seth Low Intermediate School 96, and James Madison High School.
Ownership History
Date
Name
Owned For
Owner Type
Purchase Details
Closed on
Feb 4, 2014
Sold by
Bangiyev David and Bangiyeva Valentina
Bought by
Li Haolin and Liang Xin Hong
Current Estimated Value
Purchase Details
Closed on
Feb 15, 2002
Sold by
Le Duong
Bought by
Bangiyev David and Bangiyeva Valentina
Home Financials for this Owner
Home Financials are based on the most recent Mortgage that was taken out on this home.
Original Mortgage
$270,400
Interest Rate
6.84%
Purchase Details
Closed on
Mar 24, 1997
Sold by
Klammer Florence
Bought by
Le Duong and Le Christine
Home Financials for this Owner
Home Financials are based on the most recent Mortgage that was taken out on this home.
Original Mortgage
$146,000
Interest Rate
7.88%
Purchase Details
Closed on
Dec 14, 1994
Sold by
Klammer Florence
Bought by
Klammer Florence
Create a Home Valuation Report for This Property
The Home Valuation Report is an in-depth analysis detailing your home's value as well as a comparison with similar homes in the area
Home Values in the Area
Average Home Value in this Area
Purchase History
| Date | Buyer | Sale Price | Title Company |
|---|---|---|---|
| Li Haolin | $655,000 | -- | |
| Li Haolin | $655,000 | -- | |
| Bangiyev David | -- | -- | |
| Bangiyev David | -- | -- | |
| Le Duong | $183,000 | -- | |
| Le Duong | $183,000 | -- | |
| Klammer Florence | -- | First American Title Ins Co | |
| Klammer Florence | -- | First American Title Ins Co |
Source: Public Records
Mortgage History
| Date | Status | Borrower | Loan Amount |
|---|---|---|---|
| Previous Owner | Bangiyev David | $270,400 | |
| Previous Owner | Le Duong | $146,000 |
Source: Public Records
Tax History Compared to Growth
Tax History
| Year | Tax Paid | Tax Assessment Tax Assessment Total Assessment is a certain percentage of the fair market value that is determined by local assessors to be the total taxable value of land and additions on the property. | Land | Improvement |
|---|---|---|---|---|
| 2025 | $7,187 | $50,940 | $13,800 | $37,140 |
| 2024 | $7,187 | $58,020 | $13,800 | $44,220 |
| 2023 | $6,840 | $61,200 | $13,800 | $47,400 |
| 2022 | $6,578 | $59,820 | $13,800 | $46,020 |
| 2021 | $6,761 | $56,040 | $13,800 | $42,240 |
| 2020 | $3,288 | $56,760 | $13,800 | $42,960 |
| 2019 | $6,189 | $56,760 | $13,800 | $42,960 |
| 2018 | $5,661 | $29,232 | $7,372 | $21,860 |
| 2017 | $5,542 | $28,656 | $8,107 | $20,549 |
| 2016 | $5,277 | $27,945 | $8,188 | $19,757 |
| 2015 | $3,041 | $27,370 | $8,998 | $18,372 |
| 2014 | $3,041 | $25,821 | $10,180 | $15,641 |
Source: Public Records
Map
Nearby Homes
- 2039 78th St
- 2055 77th St
- 7913 20th Ave
- 2024 80th St
- 7615 21st Ave
- 2125 77th St
- 2101 76th St
- 2029 82nd St
- 2112 Bay Ridge Pkwy
- 1939 80th St
- 1927 78th St Unit 4A
- 2150 80th St
- 2153 81st St Unit 2A
- 2172 76th St
- 7620 Bay Pkwy Unit 4B
- 7420 20th Ave
- 7616 Bay Pkwy Unit 5-B
- 7616 Bay Pkwy Unit PH-A
- 7616 Bay Pkwy Unit 3-A
- 2152 81st St Unit 3A