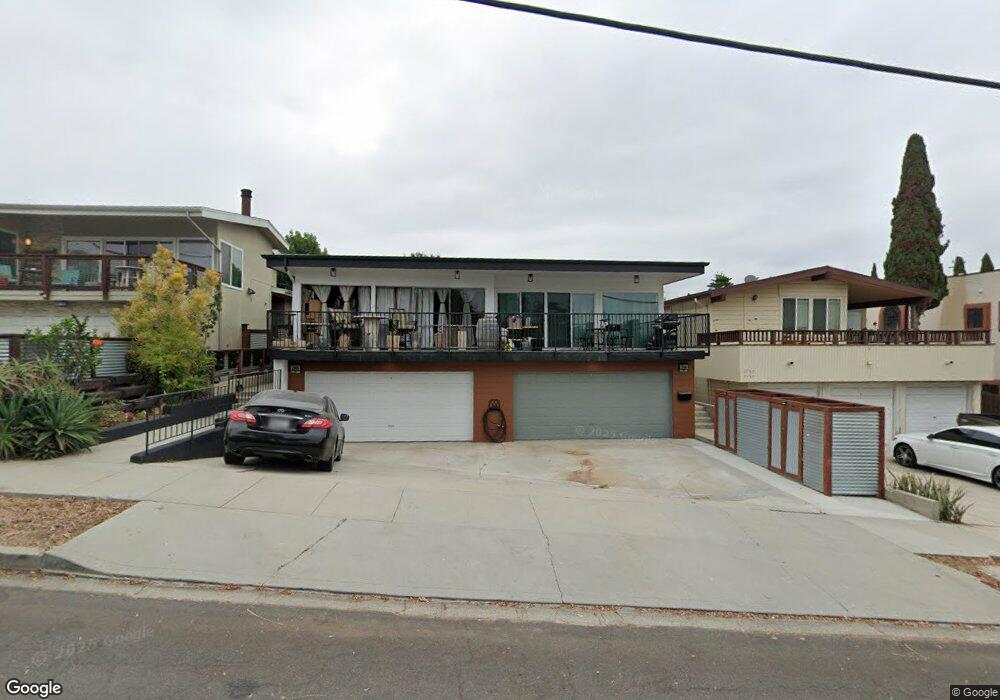
2066 Dawson Ave Signal Hill, CA 90755
Estimated Value: $1,100,000 - $1,262,179
4
Beds
4
Baths
2,690
Sq Ft
$426/Sq Ft
Est. Value
About This Home
This home is located at 2066 Dawson Ave, Signal Hill, CA 90755 and is currently estimated at $1,146,545, approximately $426 per square foot. 2066 Dawson Ave is a home located in Los Angeles County with nearby schools including Alvarado Elementary, Nelson Academy, and Woodrow Wilson High School.
Ownership History
Date
Name
Owned For
Owner Type
Purchase Details
Closed on
Dec 5, 2013
Sold by
Garcia Mario and Garcia Jeffie
Bought by
Garcia Mario and Garcia Jeffie
Current Estimated Value
Home Financials for this Owner
Home Financials are based on the most recent Mortgage that was taken out on this home.
Original Mortgage
$450,000
Outstanding Balance
$334,075
Interest Rate
4.04%
Mortgage Type
New Conventional
Estimated Equity
$812,470
Purchase Details
Closed on
Jan 15, 2009
Sold by
The Gertrude S Briggs 2003 Trust
Bought by
Garcia Mario and Sy Jeffie
Home Financials for this Owner
Home Financials are based on the most recent Mortgage that was taken out on this home.
Original Mortgage
$476,215
Interest Rate
5.19%
Mortgage Type
FHA
Purchase Details
Closed on
Dec 4, 2003
Sold by
Briggs Gertrude S
Bought by
Briggs Gertrude S and Gertrudes S Briggs 2003 Trust
Create a Home Valuation Report for This Property
The Home Valuation Report is an in-depth analysis detailing your home's value as well as a comparison with similar homes in the area
Home Values in the Area
Average Home Value in this Area
Purchase History
| Date | Buyer | Sale Price | Title Company |
|---|---|---|---|
| Garcia Mario | -- | None Available | |
| Garcia Mario | $485,000 | Chicago Title | |
| Briggs Gertrude S | -- | -- |
Source: Public Records
Mortgage History
| Date | Status | Borrower | Loan Amount |
|---|---|---|---|
| Open | Garcia Mario | $450,000 | |
| Previous Owner | Garcia Mario | $476,215 |
Source: Public Records
Tax History Compared to Growth
Tax History
| Year | Tax Paid | Tax Assessment Tax Assessment Total Assessment is a certain percentage of the fair market value that is determined by local assessors to be the total taxable value of land and additions on the property. | Land | Improvement |
|---|---|---|---|---|
| 2025 | $8,512 | $624,548 | $347,687 | $276,861 |
| 2024 | $8,512 | $612,303 | $340,870 | $271,433 |
| 2023 | $8,374 | $600,298 | $334,187 | $266,111 |
| 2022 | $7,883 | $588,529 | $327,635 | $260,894 |
| 2021 | $7,724 | $576,990 | $321,211 | $255,779 |
| 2019 | $7,618 | $559,879 | $311,685 | $248,194 |
| 2018 | $7,357 | $548,902 | $305,574 | $243,328 |
| 2016 | $6,782 | $527,589 | $293,709 | $233,880 |
| 2015 | $6,527 | $519,665 | $289,298 | $230,367 |
| 2014 | $6,491 | $509,487 | $283,632 | $225,855 |
Source: Public Records
Map
Nearby Homes
- 1965 Saint Louis Ave
- 1988 Junipero Ave
- 1994 Stanley Ave
- 1887 Saint Louis Ave
- 2231 Saint Louis Ave Unit 101B
- 1845 Dawson Ave
- 2215 Molino Ave Unit C
- 2722 E 20th St Unit 104
- 2240 N Legion Dr Unit 217
- 2240 Stanley Ave Unit 5
- 1850 Gardenia Ave
- 2199 Ohio Ave
- 2150 Ohio Ave Unit E
- 2298 Rose Ave Unit 110
- 2071 Crescent Dr
- 2205 Starlight Ln
- 2720 E Wall St
- 2238 Walnut Ave
- 2240 Walnut Ave
- 1837 Temple Ave Unit C
- 2062 Dawson Ave
- 2070 Dawson Ave Unit 2072
- 2070 Dawson Ave
- 2060 Dawson Ave
- 2080 Dawson Ave
- 2061 Raymond Ave
- 2056 Dawson Ave
- 2077 Raymond Ave
- 2238 E 21st St
- 2200 E 21st St
- 2081 Raymond Ave
- 2040 Dawson Ave
- 2041 Raymond Ave
- 2061 Dawson Ave
- 2055 Dawson Ave
- 2244 E 21st St
- 2081 Dawson Ave
- 2045 Dawson Ave
- 2031 Raymond Ave
- 2022 Dawson Ave