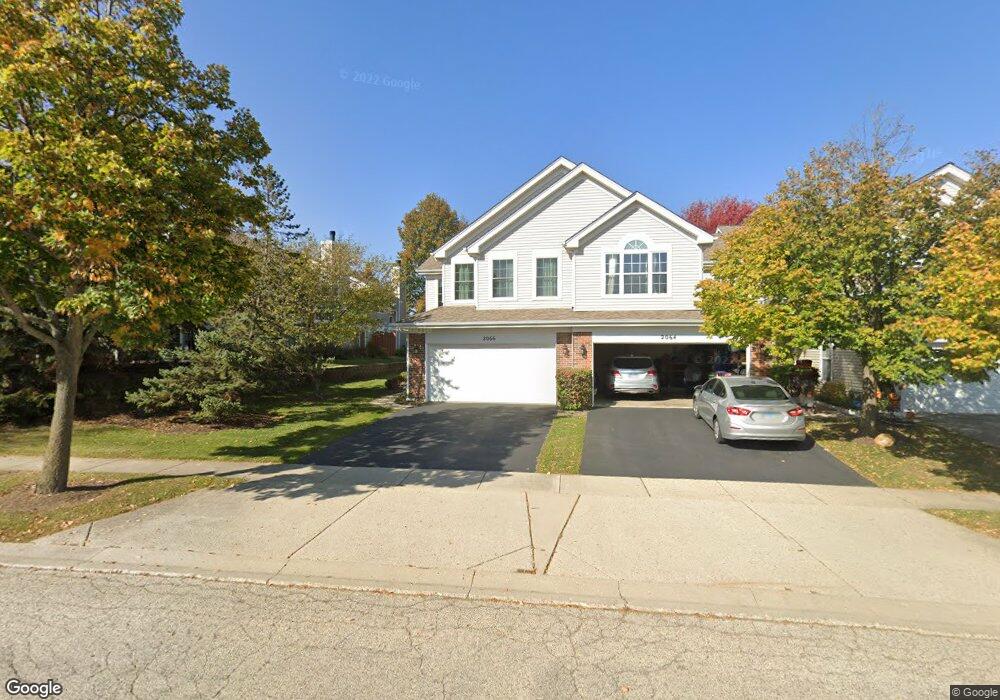
2066 Peach Tree Ln Unit 4181 Algonquin, IL 60102
Estimated Value: $308,025 - $318,000
2
Beds
3
Baths
1,515
Sq Ft
$207/Sq Ft
Est. Value
About This Home
This home is located at 2066 Peach Tree Ln Unit 4181, Algonquin, IL 60102 and is currently estimated at $313,756, approximately $207 per square foot. 2066 Peach Tree Ln Unit 4181 is a home located in Kane County with nearby schools including Westfield Community School, United Junior High School, and Harry D Jacobs High School.
Ownership History
Date
Name
Owned For
Owner Type
Purchase Details
Closed on
Apr 23, 2007
Sold by
Cwik Susan Jane and Cwik Susan J
Bought by
Derose Nirda
Current Estimated Value
Home Financials for this Owner
Home Financials are based on the most recent Mortgage that was taken out on this home.
Original Mortgage
$195,000
Outstanding Balance
$157,331
Interest Rate
6.27%
Mortgage Type
Purchase Money Mortgage
Estimated Equity
$156,425
Purchase Details
Closed on
Sep 19, 1997
Sold by
Casey Anita L
Bought by
Cwik Susan Jane
Home Financials for this Owner
Home Financials are based on the most recent Mortgage that was taken out on this home.
Original Mortgage
$112,000
Interest Rate
7.54%
Purchase Details
Closed on
Apr 30, 1996
Sold by
Willoughby Farms Townhomes Ltd Prtnrshp
Bought by
Casey Anita L
Home Financials for this Owner
Home Financials are based on the most recent Mortgage that was taken out on this home.
Original Mortgage
$68,000
Interest Rate
8.1%
Create a Home Valuation Report for This Property
The Home Valuation Report is an in-depth analysis detailing your home's value as well as a comparison with similar homes in the area
Home Values in the Area
Average Home Value in this Area
Purchase History
| Date | Buyer | Sale Price | Title Company |
|---|---|---|---|
| Derose Nirda | $195,000 | Accommodation | |
| Cwik Susan Jane | $93,333 | Chicago Title Insurance Co | |
| Casey Anita L | $138,500 | Chicago Title Insurance Co |
Source: Public Records
Mortgage History
| Date | Status | Borrower | Loan Amount |
|---|---|---|---|
| Open | Derose Nirda | $195,000 | |
| Previous Owner | Cwik Susan Jane | $112,000 | |
| Previous Owner | Casey Anita L | $68,000 |
Source: Public Records
Tax History Compared to Growth
Tax History
| Year | Tax Paid | Tax Assessment Tax Assessment Total Assessment is a certain percentage of the fair market value that is determined by local assessors to be the total taxable value of land and additions on the property. | Land | Improvement |
|---|---|---|---|---|
| 2024 | -- | $77,302 | $8,371 | $68,931 |
| 2023 | -- | $69,554 | $7,532 | $62,022 |
| 2022 | $0 | $67,397 | $7,532 | $59,865 |
| 2021 | $0 | $63,636 | $7,112 | $56,524 |
| 2020 | $4,383 | $62,205 | $6,952 | $55,253 |
| 2019 | $4,383 | $59,052 | $6,600 | $52,452 |
| 2018 | $0 | $47,936 | $6,469 | $41,467 |
| 2017 | $0 | $44,841 | $6,051 | $38,790 |
| 2016 | $4,383 | $43,417 | $5,859 | $37,558 |
| 2015 | -- | $40,683 | $5,490 | $35,193 |
| 2014 | -- | $39,559 | $5,338 | $34,221 |
| 2013 | -- | $46,850 | $5,501 | $41,349 |
Source: Public Records
Map
Nearby Homes
- 2101 Peach Tree Ln Unit 4094
- 2043 Peach Tree Ln Unit 4122
- 000 County Line Rd
- 2161 Burnham Ct
- 1971 Peach Tree Ln
- 30 Arbordale Ct Unit 4284
- 1900 Waverly Ln
- 2060 Dorchester Ave
- Marianne Plan at Algonquin Meadows - Traditional Townhomes
- Darcy Plan at Algonquin Meadows - Traditional Townhomes
- Charlotte Plan at Algonquin Meadows - Traditional Townhomes
- Adams Plan at Algonquin Meadows - Single Family
- Sequoia Plan at Algonquin Meadows - Single Family
- Bryce Plan at Algonquin Meadows - Single Family
- Rainier Plan at Algonquin Meadows - Single Family
- Santa Rosa Plan at Algonquin Meadows - Single Family
- Biscayne Plan at Algonquin Meadows - Single Family
- Amherst Plan at Algonquin Meadows - Urban Townhomes
- Chatham Plan at Algonquin Meadows - Urban Townhomes
- Chelsea Plan at Algonquin Meadows - Urban Townhomes
- 2064 Peach Tree Ln Unit 4182
- 2062 Peach Tree Ln Unit 4183
- 2062 Peach Tree Ln Unit 2062
- 2062 Peach Tree Ln Unit 2052
- 2138 Peach Tree Ln Unit 4252
- 2136 Peach Tree Ln Unit 4253
- 2132 Peach Tree Ln
- 2134 Peach Tree Ln Unit 4254
- 2138 Peach Tree Ln Unit 2
- 2060 Peach Tree Ln Unit 4184
- 8 Dellwood Ct Unit 4191
- 6 Dellwood Ct Unit 4192
- 4 Dellwood Ct Unit 4193
- 28 Dellwood Ct Unit 4215
- 2 Dellwood Ct Unit 4194
- 2065 Peach Tree Ln Unit 4114
- 2063 Peach Tree Ln Unit 4113
- 2061 Peach Tree Ln Unit 4112
- 2054 Peach Tree Ln Unit 4171
- 2067 Peach Tree Ln Unit 4115