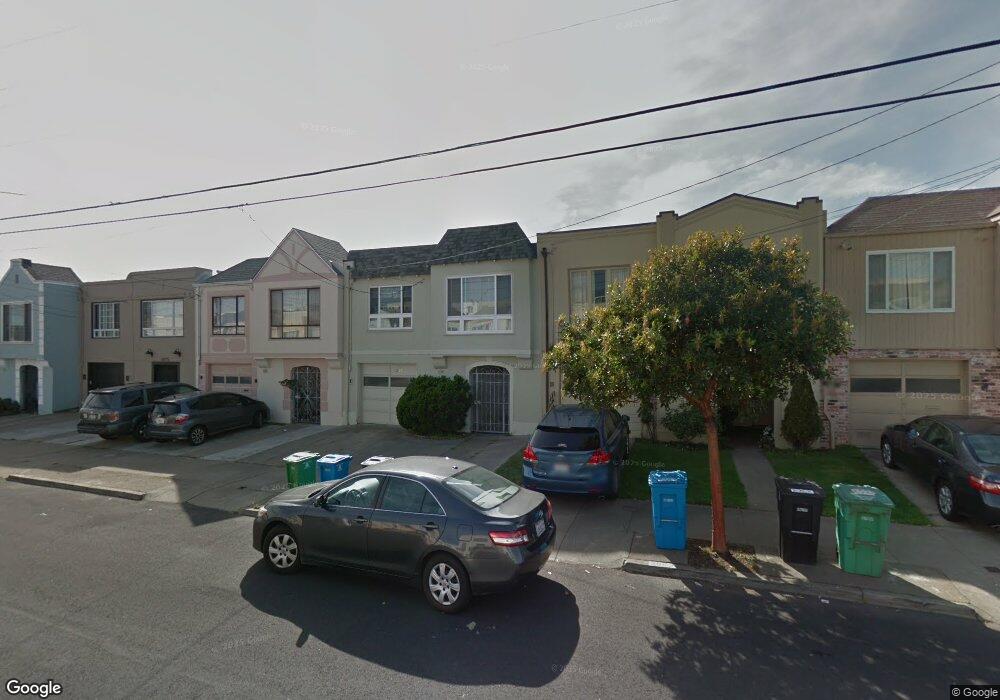
2067 44th Ave San Francisco, CA 94116
Outer Parkside NeighborhoodEstimated Value: $1,402,000 - $1,534,000
2
Beds
1
Bath
1,494
Sq Ft
$997/Sq Ft
Est. Value
About This Home
This home is located at 2067 44th Ave, San Francisco, CA 94116 and is currently estimated at $1,489,283, approximately $996 per square foot. 2067 44th Ave is a home located in San Francisco County with nearby schools including Sunset Elementary School, Giannini (A.P.) Middle School, and St. Gabriel School.
Ownership History
Date
Name
Owned For
Owner Type
Purchase Details
Closed on
Mar 16, 2020
Sold by
Roffman Leslie E
Bought by
Roffman Leslie E and Leslie E Roffman Living Trust
Current Estimated Value
Purchase Details
Closed on
Jan 3, 2007
Sold by
Balter David M
Bought by
Roffman Leslie E
Home Financials for this Owner
Home Financials are based on the most recent Mortgage that was taken out on this home.
Original Mortgage
$532,800
Outstanding Balance
$316,802
Interest Rate
6.12%
Mortgage Type
Purchase Money Mortgage
Estimated Equity
$1,172,481
Purchase Details
Closed on
Mar 9, 1998
Sold by
Gilbert Oei
Bought by
Balter David M and Roffman Leslie E
Home Financials for this Owner
Home Financials are based on the most recent Mortgage that was taken out on this home.
Original Mortgage
$299,250
Interest Rate
7.11%
Create a Home Valuation Report for This Property
The Home Valuation Report is an in-depth analysis detailing your home's value as well as a comparison with similar homes in the area
Home Values in the Area
Average Home Value in this Area
Purchase History
| Date | Buyer | Sale Price | Title Company |
|---|---|---|---|
| Roffman Leslie E | -- | None Available | |
| Roffman Leslie E | $377,000 | Financial Title Company | |
| Balter David M | $315,000 | Fidelity National Title Co |
Source: Public Records
Mortgage History
| Date | Status | Borrower | Loan Amount |
|---|---|---|---|
| Open | Roffman Leslie E | $532,800 | |
| Previous Owner | Balter David M | $299,250 |
Source: Public Records
Tax History Compared to Growth
Tax History
| Year | Tax Paid | Tax Assessment Tax Assessment Total Assessment is a certain percentage of the fair market value that is determined by local assessors to be the total taxable value of land and additions on the property. | Land | Improvement |
|---|---|---|---|---|
| 2025 | $9,396 | $756,542 | $528,100 | $228,442 |
| 2024 | $9,396 | $741,710 | $517,746 | $223,964 |
| 2023 | $9,247 | $727,169 | $507,595 | $219,574 |
| 2022 | $9,143 | $712,912 | $497,643 | $215,269 |
| 2021 | $8,978 | $698,935 | $487,886 | $211,049 |
| 2020 | $9,081 | $691,770 | $482,884 | $208,886 |
| 2019 | $8,774 | $678,209 | $473,417 | $204,792 |
| 2018 | $8,476 | $664,913 | $464,135 | $200,778 |
| 2017 | $8,079 | $651,878 | $455,035 | $196,843 |
| 2016 | $7,928 | $639,099 | $446,114 | $192,985 |
| 2015 | $7,827 | $629,501 | $439,413 | $190,088 |
| 2014 | $7,622 | $617,171 | $430,806 | $186,365 |
Source: Public Records
Map
Nearby Homes
- 2142 43rd Ave
- 2115 42nd Ave
- 3421 Rivera St
- 3622 Rivera St
- 2026 Great Hwy
- 1871 45th Ave
- 3917 Noriega St
- 2395 44th Ave
- 3621 Moraga St
- 1722-1724 48th Ave
- 1834 38th Ave
- 3043 Noriega St
- 4108 Moraga St Unit 4110
- 2274 36th Ave
- 1970 35th Ave
- 2275 35th Ave
- 1586 44th Ave
- 1974 34th Ave
- 1735 35th Ave
- 1580 Great Hwy Unit 4