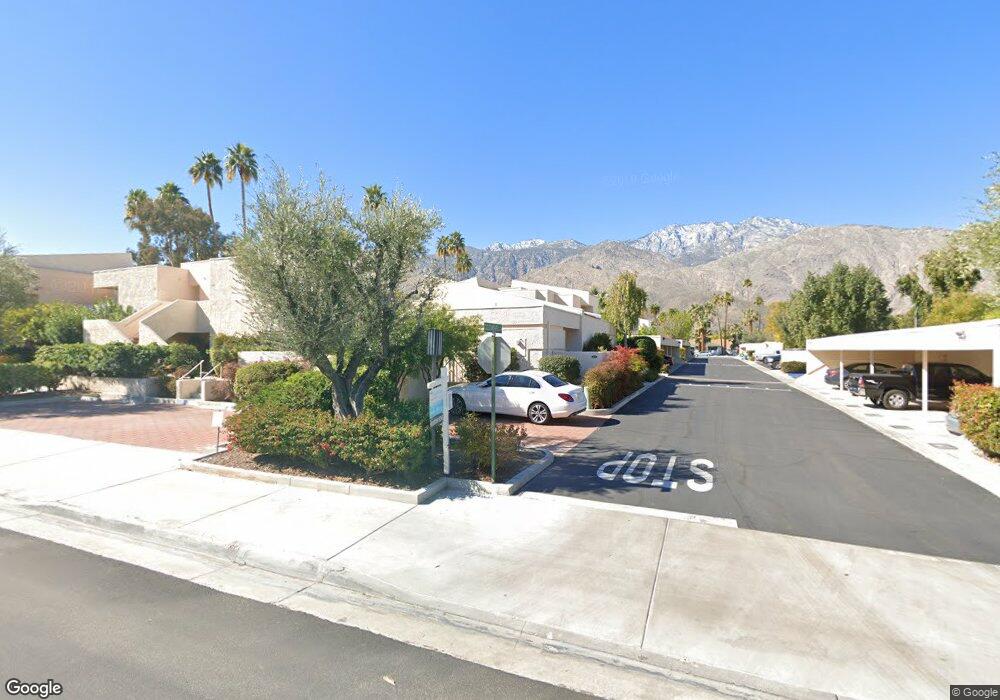
2067 E Columbard Dr Palm Springs, CA 92264
Sonora Sunrise NeighborhoodEstimated Value: $409,571 - $466,000
2
Beds
2
Baths
1,305
Sq Ft
$333/Sq Ft
Est. Value
About This Home
This home is located at 2067 E Columbard Dr, Palm Springs, CA 92264 and is currently estimated at $434,893, approximately $333 per square foot. 2067 E Columbard Dr is a home located in Riverside County with nearby schools including Cahuilla Elementary School, Raymond Cree Middle School, and Palm Springs High School.
Ownership History
Date
Name
Owned For
Owner Type
Purchase Details
Closed on
Mar 5, 2024
Sold by
Dps Capital Investments Llc
Bought by
Hallett Corey
Current Estimated Value
Home Financials for this Owner
Home Financials are based on the most recent Mortgage that was taken out on this home.
Original Mortgage
$330,400
Outstanding Balance
$324,915
Interest Rate
6.64%
Mortgage Type
New Conventional
Estimated Equity
$109,978
Purchase Details
Closed on
Jul 7, 2023
Sold by
Sharon Annette Castle Revocable Trust
Bought by
Dps Capital Investments Llc
Purchase Details
Closed on
Feb 26, 2020
Sold by
Castle Sharon A
Bought by
Castle Sharon Annette
Purchase Details
Closed on
Aug 18, 2005
Sold by
Hurst Nay Leslie C
Bought by
Castle Sharon A
Home Financials for this Owner
Home Financials are based on the most recent Mortgage that was taken out on this home.
Original Mortgage
$186,500
Interest Rate
5.87%
Mortgage Type
Purchase Money Mortgage
Purchase Details
Closed on
May 9, 2000
Sold by
Taylor Winston E
Bought by
Taylor Winston E
Create a Home Valuation Report for This Property
The Home Valuation Report is an in-depth analysis detailing your home's value as well as a comparison with similar homes in the area
Home Values in the Area
Average Home Value in this Area
Purchase History
| Date | Buyer | Sale Price | Title Company |
|---|---|---|---|
| Hallett Corey | $413,000 | Equity Title | |
| Dps Capital Investments Llc | $350,000 | Orange Coast Title | |
| Castle Sharon Annette | -- | None Available | |
| Castle Sharon A | $287,500 | Chicago Title Company | |
| Taylor Winston E | -- | -- |
Source: Public Records
Mortgage History
| Date | Status | Borrower | Loan Amount |
|---|---|---|---|
| Open | Hallett Corey | $330,400 | |
| Previous Owner | Castle Sharon A | $186,500 |
Source: Public Records
Tax History Compared to Growth
Tax History
| Year | Tax Paid | Tax Assessment Tax Assessment Total Assessment is a certain percentage of the fair market value that is determined by local assessors to be the total taxable value of land and additions on the property. | Land | Improvement |
|---|---|---|---|---|
| 2025 | $4,508 | $421,260 | $105,315 | $315,945 |
| 2023 | $4,508 | $377,612 | $114,920 | $262,692 |
| 2022 | $5,033 | $370,209 | $112,667 | $257,542 |
| 2021 | $3,763 | $272,192 | $82,482 | $189,710 |
| 2020 | $3,328 | $247,447 | $74,984 | $172,463 |
| 2019 | $3,244 | $240,240 | $72,800 | $167,440 |
| 2018 | $3,130 | $231,000 | $70,000 | $161,000 |
| 2017 | $3,094 | $227,000 | $69,000 | $158,000 |
| 2016 | $3,063 | $227,000 | $69,000 | $158,000 |
| 2015 | $2,771 | $210,000 | $64,000 | $146,000 |
| 2014 | $2,495 | $187,000 | $57,000 | $130,000 |
Source: Public Records
Map
Nearby Homes
- 1602 S Cerritos Dr Unit C
- 1621 S Cerritos Dr
- 1602 S Andee Dr Unit 65
- 1680 S Andee Dr
- 1630 S La Reina Way Unit 3C
- 1975 E Mark Leslie Dr
- 2371 Via Sonoma Unit B
- 1732 Capri Cir
- 2454 E Palm Canyon Dr Unit 1A
- 2424 E Palm Canyon Dr Unit 2D
- 2455 Via Sonoma Unit F
- 1729 Capri Cir
- 2232 Oakcrest Dr
- 1719 Capri Cir
- 2365 S Oakcrest Dr
- 1645 S Sunrise Way
- 1657 S Sunrise Way
- 1207 Antigua Cir
- 1731 Grand Bahama Dr W
- 2264 Oakcrest Dr
- 2067 E Colombard Dr
- 2071 E Columbard Dr
- 2061 E Columbard Dr Unit 45
- 2057 E Columbard Dr Unit 44
- 1591 S Cerritos Dr
- 2051 E Columbard Dr
- 2047 E Columbard Dr
- 1601 S Cerritos Dr Unit 40
- 1581 S Cerritos Dr
- 2051 E Colombard Dr
- 1611 S Cerritos Dr
- 1631 S Cerritos Dr
- 2027 E Columbard Dr
- 2021 E Columbard Dr
- 2017 E Columbard Dr
- 1561 S Cerritos Dr
- 2038 Normandy Ct
- 2011 E Columbard Dr
- 2007 E Columbard Dr Unit 52
- 2007 E Colombard Dr Unit 52