2067 John St Hamilton, OH 45011
Estimated Value: $124,000 - $157,000
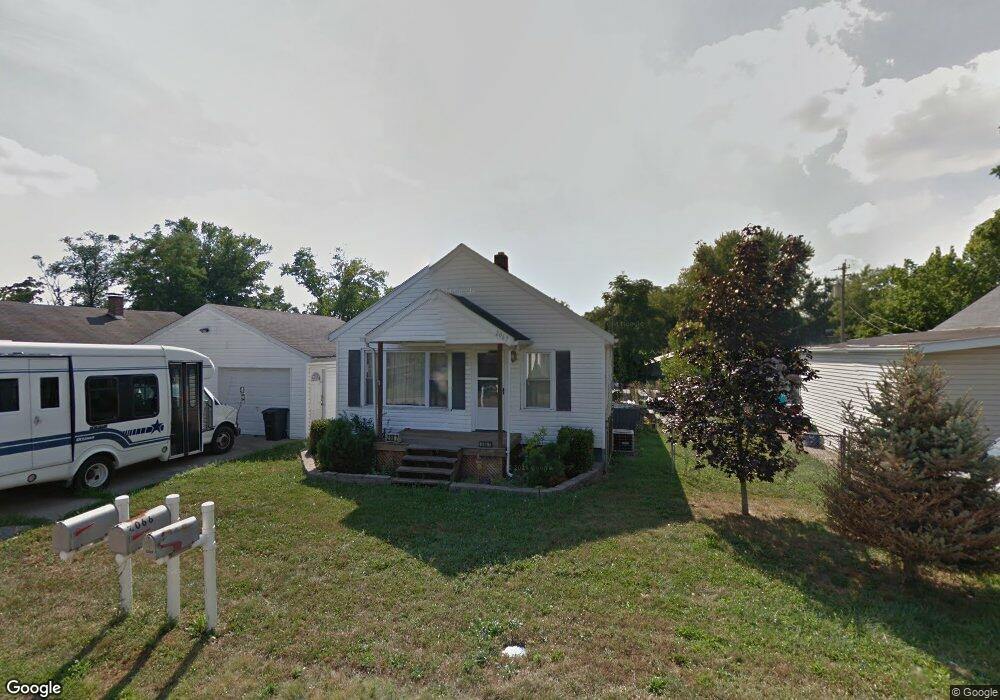
About This Home
This home is located at 2067 John St, Hamilton, OH 45011 and is currently estimated at $139,601, approximately $171 per square foot. 2067 John St is a home located in Butler County with nearby schools including New Miami Elementary School, New Miami Middle School, and New Miami High School.
Ownership History
We collect this data history from publicly available records. To have your information removed, we recommend requesting removal directly through your county’s website.
Purchase Details
Home Financials for this Owner
Home Financials are based on the most recent Mortgage that was taken out on this home.Purchase Details
Home Financials for this Owner
Home Financials are based on the most recent Mortgage that was taken out on this home.Purchase Details
Purchase Details
Purchase Details
Home Values in the Area
Average Home Value in this Area
Purchase History
We collect this data history from publicly available records. To have your information removed, we recommend requesting removal directly through your county’s website.
| Date | Buyer | Sale Price | Title Company |
|---|---|---|---|
| $78,000 | -- | ||
| $61,750 | -- | ||
| $32,500 | -- | ||
| $32,500 | -- | ||
| -- | -- |
Mortgage History
We collect this data history from publicly available records. To have your information removed, we recommend requesting removal directly through your county’s website.
| Date | Status | Borrower | Loan Amount |
|---|---|---|---|
| Open | $62,400 | ||
| Previous Owner | $59,890 |
Tax History
We collect this data history from publicly available records. To have your information removed, we recommend requesting removal directly through your county’s website.
| Year | Tax Paid | Tax Assessment Tax Assessment Total Assessment is a certain percentage of the fair market value that is determined by local assessors to be the total taxable value of land and additions on the property. | Land | Improvement |
|---|---|---|---|---|
| 2025 | $1,295 | $27,500 | $5,880 | $21,620 |
| 2024 | $1,295 | $27,500 | $5,880 | $21,620 |
| 2023 | $1,269 | $27,500 | $5,880 | $21,620 |
| 2022 | $1,179 | $21,630 | $5,880 | $15,750 |
| 2021 | $1,565 | $21,630 | $5,880 | $15,750 |
| 2020 | $1,624 | $21,630 | $5,880 | $15,750 |
| 2019 | $1,087 | $21,520 | $5,970 | $15,550 |
| 2018 | $1,698 | $21,520 | $5,970 | $15,550 |
| 2017 | $896 | $21,520 | $5,970 | $15,550 |
| 2016 | $1,303 | $21,520 | $5,970 | $15,550 |
| 2015 | $884 | $21,520 | $5,970 | $15,550 |
| 2014 | $1,060 | $21,520 | $5,970 | $15,550 |
| 2013 | $1,060 | $21,940 | $5,970 | $15,970 |
Map
- 1972 John St
- 1913 Saint Clair St
- 1950 Williams St
- 0 Hamilton Eaton Rd
- 0 Hamilton Eaton Rd Unit 1830987
- 243 Whitaker Ave
- 107 S Riverside Dr
- 30 Seven Mile Ave
- 2477 Maple St
- 44 Martin Ave
- 264 Howman Ave
- 2678 Jackson Rd
- 2244 W Elkton Rd
- 1664 W Elkton Rd
- 1479 N B St
- 5182 Mason Pointe
- 1364 Cotswold Ln Unit 1364
- 1416 Cotswold Ln Unit 1416
- 1434 Cotswold Ln Unit 1434
- 5569 Echo Springs Dr
Ask me questions while you tour the home.