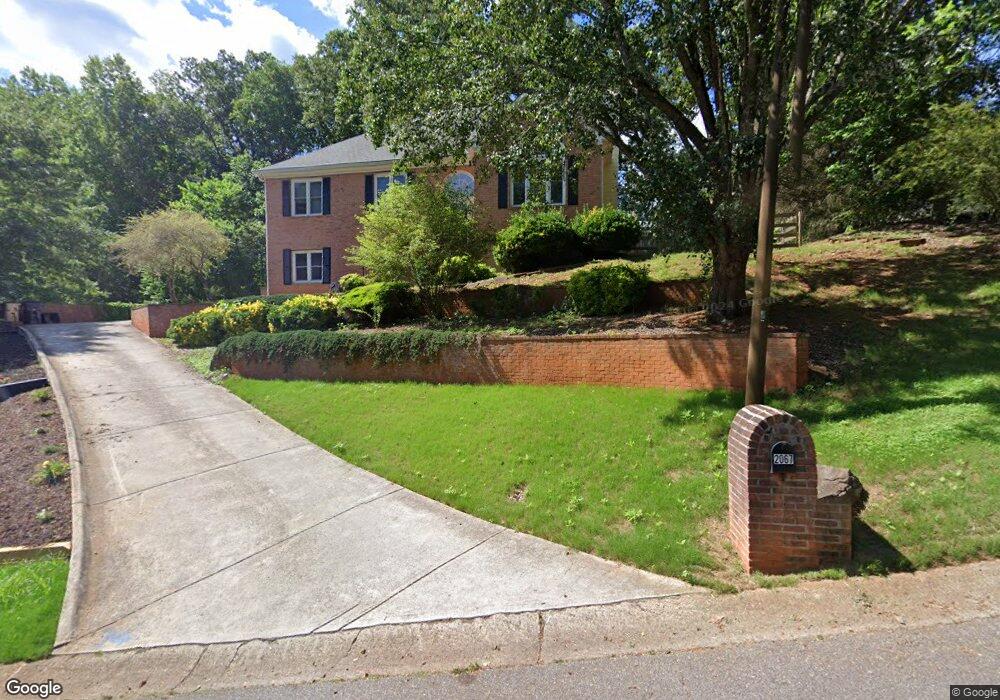
2067 Tully Wren NE Unit 12 Marietta, GA 30066
Sandy Plains NeighborhoodEstimated Value: $474,000 - $550,000
4
Beds
3
Baths
3,316
Sq Ft
$155/Sq Ft
Est. Value
About This Home
This home is located at 2067 Tully Wren NE Unit 12, Marietta, GA 30066 and is currently estimated at $514,539, approximately $155 per square foot. 2067 Tully Wren NE Unit 12 is a home located in Cobb County with nearby schools including Rocky Mount Elementary School, Simpson Middle School, and Lassiter High School.
Ownership History
Date
Name
Owned For
Owner Type
Purchase Details
Closed on
Jun 20, 2023
Sold by
Le Kirby Ashley Paul
Bought by
Mintlow Kurt and Smith Haley Alexandra
Current Estimated Value
Home Financials for this Owner
Home Financials are based on the most recent Mortgage that was taken out on this home.
Original Mortgage
$427,500
Outstanding Balance
$415,526
Interest Rate
6.35%
Mortgage Type
New Conventional
Estimated Equity
$99,013
Purchase Details
Closed on
Dec 10, 2018
Sold by
Tilden Ronald J
Bought by
Kirby Ashley Paul and Tilden Linda E
Home Financials for this Owner
Home Financials are based on the most recent Mortgage that was taken out on this home.
Original Mortgage
$323,924
Interest Rate
4.9%
Mortgage Type
FHA
Purchase Details
Closed on
Dec 27, 1996
Sold by
Dudley Todd C Kellie T
Bought by
Tilden Ronald J Linda G
Create a Home Valuation Report for This Property
The Home Valuation Report is an in-depth analysis detailing your home's value as well as a comparison with similar homes in the area
Home Values in the Area
Average Home Value in this Area
Purchase History
| Date | Buyer | Sale Price | Title Company |
|---|---|---|---|
| Mintlow Kurt | $450,000 | None Listed On Document | |
| Kirby Ashley Paul | $329,900 | -- | |
| Tilden Ronald J Linda G | $156,000 | -- |
Source: Public Records
Mortgage History
| Date | Status | Borrower | Loan Amount |
|---|---|---|---|
| Open | Mintlow Kurt | $427,500 | |
| Previous Owner | Kirby Ashley Paul | $323,924 | |
| Closed | Tilden Ronald J Linda G | $0 |
Source: Public Records
Tax History Compared to Growth
Tax History
| Year | Tax Paid | Tax Assessment Tax Assessment Total Assessment is a certain percentage of the fair market value that is determined by local assessors to be the total taxable value of land and additions on the property. | Land | Improvement |
|---|---|---|---|---|
| 2025 | $6,585 | $218,560 | $50,000 | $168,560 |
| 2024 | $5,427 | $180,000 | $43,320 | $136,680 |
| 2023 | $4,280 | $184,208 | $34,000 | $150,208 |
| 2022 | $4,858 | $184,208 | $34,000 | $150,208 |
| 2021 | $3,690 | $130,844 | $30,400 | $100,444 |
| 2020 | $3,690 | $130,844 | $30,400 | $100,444 |
| 2019 | $3,669 | $129,920 | $30,400 | $99,520 |
| 2018 | $812 | $129,920 | $30,400 | $99,520 |
| 2017 | $711 | $120,704 | $28,000 | $92,704 |
| 2016 | $686 | $110,556 | $22,000 | $88,556 |
| 2015 | $731 | $110,556 | $22,000 | $88,556 |
| 2014 | $694 | $96,652 | $0 | $0 |
Source: Public Records
Map
Nearby Homes
- 3634 Stonehenge Way NE
- 3835 Rockhaven Ct
- 1984 Credence Ct NE
- 3287 Allegheny Dr
- 3812 Havenrock Dr
- 3816 Havenrock Dr
- 3844 Havenrock
- 3663 Heatherwood Dr NE
- 1833 Lake Ebenezer Trail NE
- 3851 Trickum Rd NE
- 2124 Lassiter Field Dr NE
- 1810 Ebenezer Farm Cir
- 3328 Knight Rd
- 2477 Bobbie Dr
- 3703 Tulip Tree Rd
- 1849 Service Dr NE
- 4056 Longford Dr NE
- 2011 Shadowwood Dr
- 2403 Wistful Way
- 2067 Tully Wren NE
- 2057 Tully Wren NE Unit 5
- 3640 Stonehenge Way NE
- 3642 Stonehenge Way NE
- 2117 Tully Wren NE
- 2062 Tully Wren NE
- 2047 Tully Wren NE
- 3638 Stonehenge Way NE
- 2072 Tully Wren NE
- 2127 Tully Wren NE
- 3644 Stonehenge Way NE
- 2037 Tully Wren NE
- 3636 Stonehenge Way NE
- 2082 Tully Wren NE
- 0 Tully Wren NE Unit 8731897
- 0 Tully Wren NE Unit 9041631
- 0 Tully Wren NE Unit 7107425
- 0 Tully Wren NE Unit 7208849
- 0 Tully Wren NE Unit 7278428
- 0 Tully Wren NE Unit 7318028