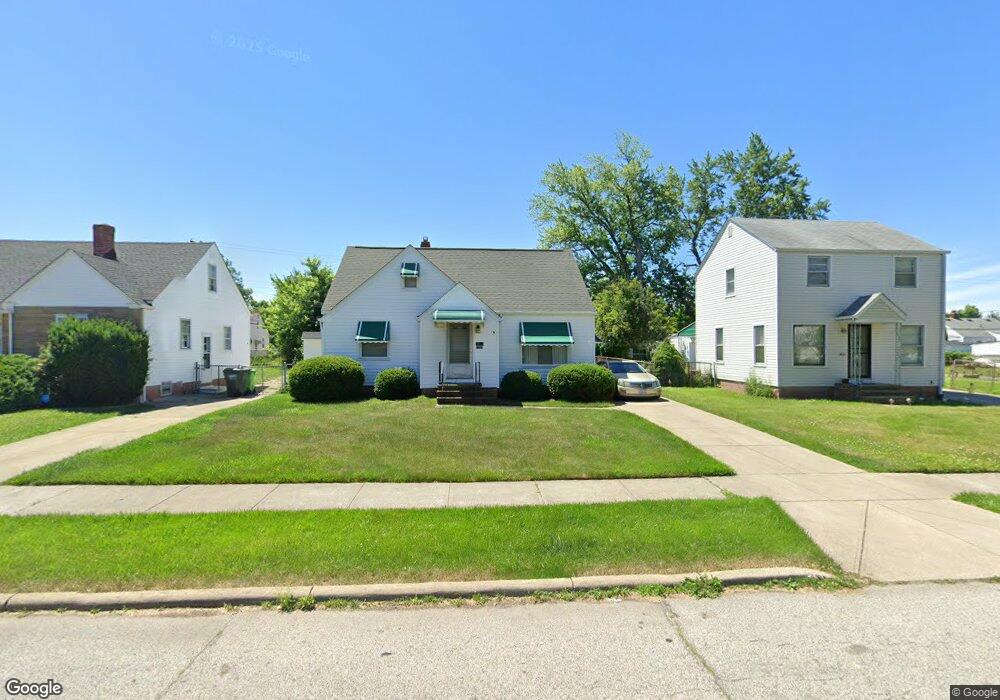
20670 Wilmore Ave Euclid, OH 44123
Estimated Value: $139,954 - $158,000
3
Beds
1
Bath
1,455
Sq Ft
$102/Sq Ft
Est. Value
About This Home
This home is located at 20670 Wilmore Ave, Euclid, OH 44123 and is currently estimated at $148,989, approximately $102 per square foot. 20670 Wilmore Ave is a home located in Cuyahoga County with nearby schools including Arbor Elementary School, Euclid Middle School, and Euclid High School.
Ownership History
Date
Name
Owned For
Owner Type
Purchase Details
Closed on
Sep 10, 2007
Sold by
Walker George G and Walker Cynthia L
Bought by
Walker George G
Current Estimated Value
Home Financials for this Owner
Home Financials are based on the most recent Mortgage that was taken out on this home.
Original Mortgage
$86,000
Outstanding Balance
$52,637
Interest Rate
5.93%
Mortgage Type
New Conventional
Estimated Equity
$96,352
Purchase Details
Closed on
May 22, 1997
Sold by
Semlow Lucille O
Bought by
Walker George G
Home Financials for this Owner
Home Financials are based on the most recent Mortgage that was taken out on this home.
Original Mortgage
$87,832
Interest Rate
8.24%
Mortgage Type
FHA
Purchase Details
Closed on
May 9, 1989
Sold by
Semlow Albert A and Semlow Lucille O
Bought by
Semlow Lucille O
Purchase Details
Closed on
Jan 1, 1975
Bought by
Semlow Albert A and Semlow Lucille O
Create a Home Valuation Report for This Property
The Home Valuation Report is an in-depth analysis detailing your home's value as well as a comparison with similar homes in the area
Home Values in the Area
Average Home Value in this Area
Purchase History
| Date | Buyer | Sale Price | Title Company |
|---|---|---|---|
| Walker George G | -- | Nations Title Agency Inc | |
| Walker George G | $87,900 | -- | |
| Semlow Lucille O | -- | -- | |
| Semlow Albert A | -- | -- |
Source: Public Records
Mortgage History
| Date | Status | Borrower | Loan Amount |
|---|---|---|---|
| Open | Walker George G | $86,000 | |
| Closed | Walker George G | $87,832 |
Source: Public Records
Tax History Compared to Growth
Tax History
| Year | Tax Paid | Tax Assessment Tax Assessment Total Assessment is a certain percentage of the fair market value that is determined by local assessors to be the total taxable value of land and additions on the property. | Land | Improvement |
|---|---|---|---|---|
| 2024 | $3,251 | $47,390 | $8,190 | $39,200 |
| 2023 | $2,427 | $27,800 | $6,480 | $21,320 |
| 2022 | $2,373 | $27,790 | $6,480 | $21,320 |
| 2021 | $2,636 | $27,790 | $6,480 | $21,320 |
| 2020 | $2,215 | $21,040 | $4,900 | $16,140 |
| 2019 | $1,989 | $60,100 | $14,000 | $46,100 |
| 2018 | $1,948 | $21,040 | $4,900 | $16,140 |
| 2017 | $2,046 | $17,890 | $3,260 | $14,630 |
| 2016 | $2,050 | $17,890 | $3,260 | $14,630 |
| 2015 | $1,869 | $17,890 | $3,260 | $14,630 |
| 2014 | $1,869 | $17,890 | $3,260 | $14,630 |
Source: Public Records
Map
Nearby Homes
- 20590 Morris Ave
- 20801 Morris Ave
- 20760 Westport Ave
- 20800 Morris Ave
- 20561 Westport Ave
- 20921 Westport Ave
- 20830 Tracy Ave
- 21051 Westport Ave
- 20540 Fuller Ave
- 20571 Naumann Ave
- 21051 Nicholas Ave
- 21170 Wilmore Ave
- 21050 Fuller Ave
- 21181 Ball Ave
- 21331 Morris Ave
- 21030 Priday Ave
- 311 E 197th St
- 21481 Ball Ave
- 21570 Ball Ave
- 21670 Wilmore Ave
- 20700 Wilmore Ave
- 20630 Wilmore Ave
- 20730 Wilmore Ave
- 20671 Morris Ave
- 20701 Morris Ave
- 20631 Morris Ave
- 20590 Wilmore Ave
- 20750 Wilmore Ave
- 20731 Morris Ave
- 20671 Wilmore Ave
- 20701 Wilmore Ave
- 20591 Morris Ave
- 20631 Wilmore Ave
- 20751 Morris Ave
- 20570 Wilmore Ave
- 20770 Wilmore Ave
- 20731 Wilmore Ave
- 20591 Wilmore Ave
- 20571 Morris Ave
- 20751 Wilmore Ave