
Estimated payment $3,790/month
Highlights
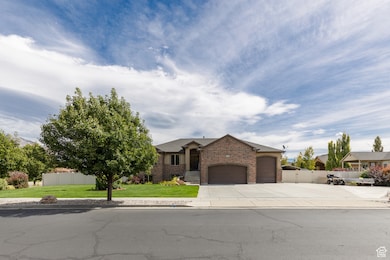
- Mature Trees
- Vaulted Ceiling
- Main Floor Primary Bedroom
- Mountain View
- Rambler Architecture
- Corner Lot
About This Home
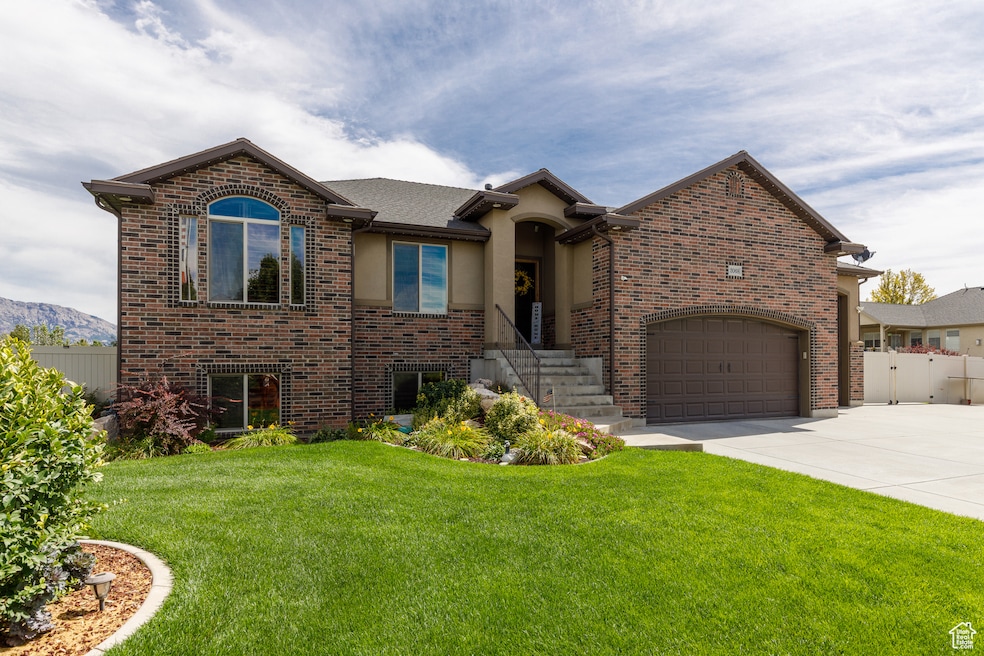
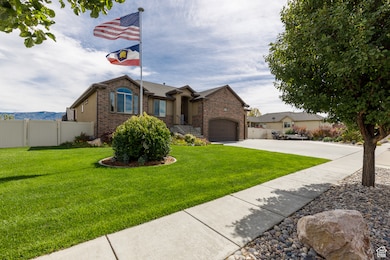
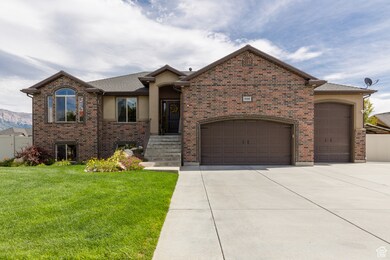
This beautiful 5 bedroom, 3 full bath home is located in one of Plain City's most desirable neighborhoods! With granite countertops and tile throughout, this home is functional with an open layout and plenty of room to host. Fully finished walkout basement offers many options with a craft room, playroom or secondary kitchen. Plenty of storage space including a shed, overhead garage storage, a greenhouse, and a carport. The yard is fully landscaped and fenced and includes a charming gazebo. Whether you're looking for room to grow, space to create, or simply a beautiful and that has been well taken care of home, this property has it all. * 2 Year Home Warranty Included
Listing Agent
Brooke Harper
Cornerstone Real Estate Professionals, LLC (South Ogden) License #12819174 Listed on: 09/11/2025
Home Details
Home Type
- Single Family
Est. Annual Taxes
- $3,000
Year Built
- Built in 2011
Lot Details
- 0.36 Acre Lot
- Property is Fully Fenced
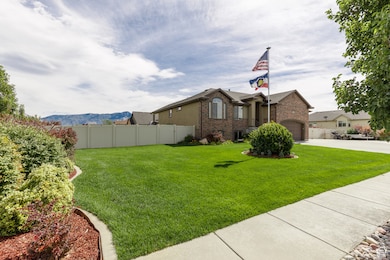
- Landscaped
- Corner Lot
- Mature Trees
- Property is zoned Single-Family
Parking
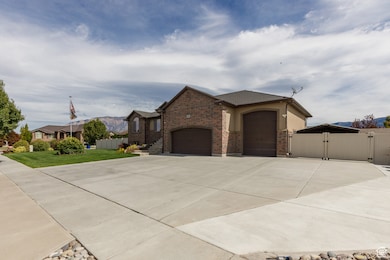
- 3 Car Attached Garage
- 1 Carport Space
Home Design
- Rambler Architecture
- Brick Exterior Construction
- Stucco
Interior Spaces
- 3,072 Sq Ft Home
- 2-Story Property
- Central Vacuum
- Vaulted Ceiling
- Ceiling Fan
- Self Contained Fireplace Unit Or Insert
- Gas Log Fireplace
- Double Pane Windows
- Plantation Shutters
- Entrance Foyer
- Den
- Mountain Views
- Basement
- Exterior Basement Entry
- Electric Dryer Hookup
Kitchen
- Microwave
- Granite Countertops
- Disposal
Flooring
- Carpet
- Linoleum
- Tile
Bedrooms and Bathrooms
- 5 Bedrooms | 3 Main Level Bedrooms
- Primary Bedroom on Main
- Walk-In Closet
- 3 Full Bathrooms
Home Security
- Alarm System
- Fire and Smoke Detector
Eco-Friendly Details
- Reclaimed Water Irrigation System
Outdoor Features
- Covered Patio or Porch
- Storage Shed
- Outbuilding
Schools
- Farr West Elementary School
- Wahlquist Middle School
- Fremont High School
Utilities
- Forced Air Heating and Cooling System
- Natural Gas Connected
Community Details
- No Home Owners Association
Listing and Financial Details
- Exclusions: Dryer, Freezer, Gas Grill/BBQ, Satellite Equipment, Satellite Dish, Washer
- Home warranty included in the sale of the property
- Assessor Parcel Number 19-261-0003
Map
Home Values in the Area
Average Home Value in this Area
Tax History
| Year | Tax Paid | Tax Assessment Tax Assessment Total Assessment is a certain percentage of the fair market value that is determined by local assessors to be the total taxable value of land and additions on the property. | Land | Improvement |
|---|---|---|---|---|
| 2025 | $2,777 | $672,121 | $216,113 | $456,008 |
| 2024 | $2,661 | $363,549 | $118,862 | $244,687 |
| 2023 | $2,605 | $351,450 | $118,807 | $232,643 |
| 2022 | $2,809 | $360,250 | $99,455 | $260,795 |
| 2021 | $2,302 | $512,000 | $115,656 | $396,344 |
| 2020 | $2,185 | $454,000 | $90,546 | $363,454 |
| 2019 | $2,435 | $427,000 | $75,403 | $351,597 |
| 2018 | $2,265 | $380,000 | $75,403 | $304,597 |
| 2017 | $2,012 | $322,000 | $77,940 | $244,060 |
| 2016 | $1,842 | $161,150 | $27,784 | $133,366 |
| 2015 | $1,975 | $169,420 | $27,784 | $141,636 |
| 2014 | $1,784 | $150,946 | $27,784 | $123,162 |
Property History
| Date | Event | Price | List to Sale | Price per Sq Ft |
|---|---|---|---|---|
| 11/29/2025 11/29/25 | Pending | -- | -- | -- |
| 09/26/2025 09/26/25 | Price Changed | $675,000 | -1.5% | $220 / Sq Ft |
| 09/11/2025 09/11/25 | For Sale | $685,000 | -- | $223 / Sq Ft |
Purchase History
| Date | Type | Sale Price | Title Company |
|---|---|---|---|
| Warranty Deed | -- | Mountain View Title | |
| Warranty Deed | -- | Bonneville Superior Title Co | |
| Warranty Deed | -- | Accommodation | |
| Corporate Deed | -- | Mountain View Title Ogden |
Mortgage History
| Date | Status | Loan Amount | Loan Type |
|---|---|---|---|
| Previous Owner | $254,675 | FHA |
Source: UtahRealEstate.com
MLS Number: 2110795
APN: 19-261-0003
Disclaimer: Certain information contained herein is derived from information provided by parties other than Homes.com. All information provided is deemed reliable, but is not guaranteed to be accurate and should be independently verified.
![]() IDX information is provided exclusively for consumers’ personal, non-commercial use, that it may not be used for any purpose other than to identify prospective properties consumers may be interested in purchasing, and that the data is deemed reliable but is not guaranteed accurate by the MLS. Licensor is only providing the MLS Content and not other sources of data provided in the Product.
IDX information is provided exclusively for consumers’ personal, non-commercial use, that it may not be used for any purpose other than to identify prospective properties consumers may be interested in purchasing, and that the data is deemed reliable but is not guaranteed accurate by the MLS. Licensor is only providing the MLS Content and not other sources of data provided in the Product.
Based on information from the Wasatch Front Regional Multiple Listing Service, Inc.. All data, including all measurements and calculations of area, is obtained from various sources and has not been, and will not be, verified by broker or the MLS. All information should be independently reviewed and verified for accuracy. Properties may or may not be listed by the office/agent presenting the information.
- 3047 N 2875 W Unit 7
- 2950 W 1975 N
- 2801 W 1900 N
- 2673 W 2125 N
- 2307 N 2850 W
- 2172 N 2625 W
- 2124 Heritage Dr
- 2443 W 2950 N Unit 99
- 2443 W 2950 N
- 2495 N 2850 W
- 2705 2825 W Unit 67
- 2081 W 1575 N Unit 127
- 4195 W 1575 N Unit 204
- 4183 W 1575 N Unit 205
- 1557 N 2750 W
- 2540 W 2575 N
- Newport Plan at Diamond E
- Orchards Townhome Plan at Orchards at JDC Ranch
- 3594 W 2200 N Unit 3
- 3505 W 2500 N