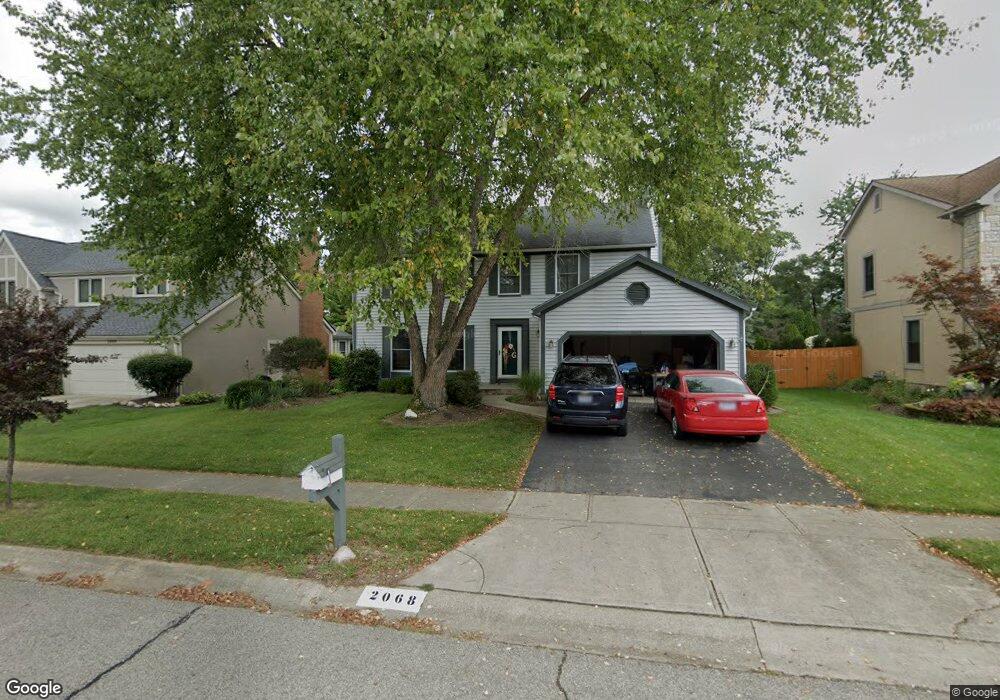
2068 Thistlewood Dr Columbus, OH 43235
Brookside Woods NeighborhoodEstimated Value: $465,219 - $583,000
4
Beds
3
Baths
2,087
Sq Ft
$250/Sq Ft
Est. Value
About This Home
This home is located at 2068 Thistlewood Dr, Columbus, OH 43235 and is currently estimated at $521,055, approximately $249 per square foot. 2068 Thistlewood Dr is a home located in Franklin County with nearby schools including Brookside Elementary School, McCord Middle School, and Worthington Kilbourne High School.
Ownership History
Date
Name
Owned For
Owner Type
Purchase Details
Closed on
Sep 21, 2020
Sold by
Colby Patricia W and Gibbs Patricia W
Bought by
Gibbs Patricia W and Gibbs Michael A
Current Estimated Value
Home Financials for this Owner
Home Financials are based on the most recent Mortgage that was taken out on this home.
Original Mortgage
$218,000
Outstanding Balance
$185,737
Interest Rate
2.9%
Mortgage Type
New Conventional
Estimated Equity
$335,318
Purchase Details
Closed on
Jul 24, 2020
Sold by
Gibbs Patricia W and Colby Patricia W
Bought by
Gibbs Patricia W and Gibbs Michael A
Home Financials for this Owner
Home Financials are based on the most recent Mortgage that was taken out on this home.
Original Mortgage
$218,000
Outstanding Balance
$185,737
Interest Rate
2.9%
Mortgage Type
New Conventional
Estimated Equity
$335,318
Purchase Details
Closed on
Mar 27, 2017
Sold by
Gardner Daniel M and Gardner Joyce M
Bought by
Colby Patricia W
Home Financials for this Owner
Home Financials are based on the most recent Mortgage that was taken out on this home.
Original Mortgage
$210,000
Interest Rate
4.17%
Mortgage Type
New Conventional
Purchase Details
Closed on
Dec 4, 1987
Create a Home Valuation Report for This Property
The Home Valuation Report is an in-depth analysis detailing your home's value as well as a comparison with similar homes in the area
Home Values in the Area
Average Home Value in this Area
Purchase History
| Date | Buyer | Sale Price | Title Company |
|---|---|---|---|
| Gibbs Patricia W | -- | Expedient Title | |
| Gibbs Patricia W | -- | Expedient Title | |
| Colby Patricia W | $309,900 | Gahannaa Title | |
| -- | $141,200 | -- |
Source: Public Records
Mortgage History
| Date | Status | Borrower | Loan Amount |
|---|---|---|---|
| Open | Gibbs Patricia W | $218,000 | |
| Previous Owner | Gibbs Patricia W | $218,000 | |
| Previous Owner | Colby Patricia W | $210,000 |
Source: Public Records
Tax History Compared to Growth
Tax History
| Year | Tax Paid | Tax Assessment Tax Assessment Total Assessment is a certain percentage of the fair market value that is determined by local assessors to be the total taxable value of land and additions on the property. | Land | Improvement |
|---|---|---|---|---|
| 2024 | $8,019 | $130,620 | $38,920 | $91,700 |
| 2023 | $7,669 | $130,620 | $38,920 | $91,700 |
| 2022 | $7,475 | $101,020 | $21,950 | $79,070 |
| 2021 | $6,896 | $101,020 | $21,950 | $79,070 |
| 2020 | $6,642 | $101,020 | $21,950 | $79,070 |
| 2019 | $6,409 | $87,960 | $19,080 | $68,880 |
| 2018 | $5,795 | $87,960 | $19,080 | $68,880 |
| 2017 | $5,562 | $87,960 | $19,080 | $68,880 |
| 2016 | $5,380 | $75,780 | $19,920 | $55,860 |
| 2015 | $5,381 | $75,780 | $19,920 | $55,860 |
| 2014 | $5,379 | $75,780 | $19,920 | $55,860 |
| 2013 | $2,676 | $75,775 | $19,915 | $55,860 |
Source: Public Records
Map
Nearby Homes
- 6921 Spruce Pine Dr
- 2161 Heatherfield Ave
- 2056 Fincastle Ct
- 7373 Palmleaf Ln
- 1930 Shallowford Ave
- 2687 Snouffer Rd
- 1721 Worthington Run Dr Unit 1721-1731
- 1889 Slaton Ct Unit 1889
- 2533 Timberside Dr
- 2001 Sawbury Blvd Unit 2001
- 1637 Park Row Dr Unit F
- 1620 Park Row Dr Unit A
- 2546 Timberside Dr Unit 2546
- 2548 Timberside Dr Unit 2548
- 2392 Dunsworth Dr
- 6755 Meadow Creek Dr Unit 103
- 6755 Meadow Creek Dr Unit 207
- 7385 Cimmaron Station
- 1828 Gardenstone Dr
- 2220 Surreygate Dr
- 2056 Thistlewood Dr
- 2080 Thistlewood Dr
- 2048 Thistlewood Dr
- 2092 Thistlewood Dr
- 2040 Thistlewood Dr
- 2100 Thistlewood Dr
- 2075 Thistlewood Dr
- 2057 Decker Ct
- 2053 Thistlewood Dr
- 2065 Decker Ct
- 2089 Thistlewood Dr
- 6790 Maybrook St
- 2045 Thistlewood Dr
- 2032 Thistlewood Dr
- 2108 Thistlewood Dr
- 2097 Thistlewood Dr
- 2049 Decker Ct
- 6803 Pine Bark Ln
- 2037 Thistlewood Dr
- 6799 Pine Bark Ln