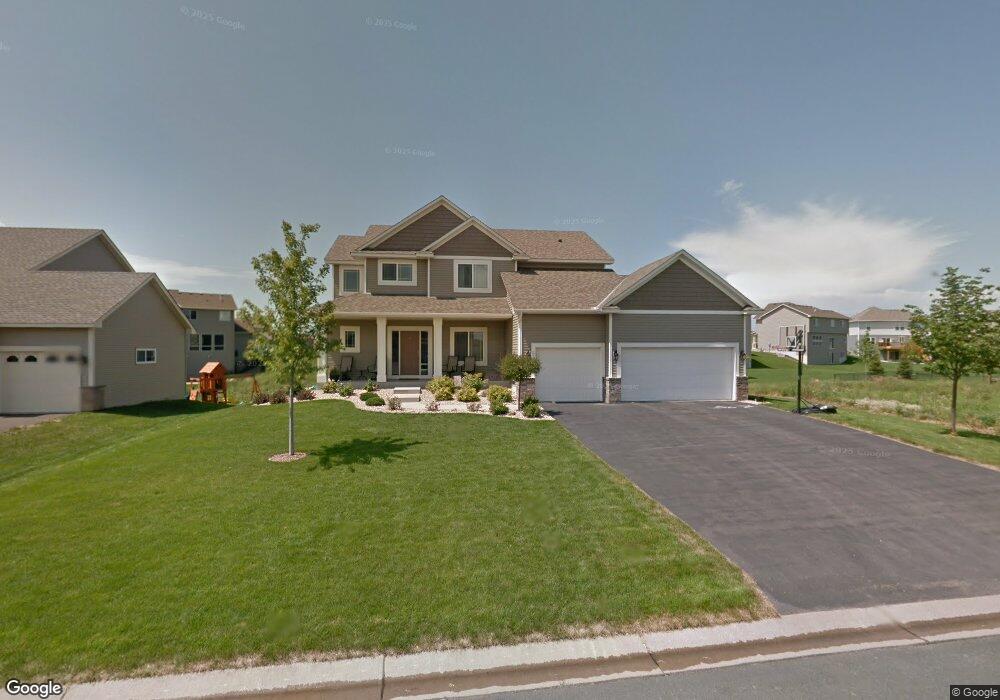
20689 Frost Ct Lakeville, MN 55044
Estimated Value: $554,400 - $602,000
5
Beds
4
Baths
2,474
Sq Ft
$233/Sq Ft
Est. Value
About This Home
This home is located at 20689 Frost Ct, Lakeville, MN 55044 and is currently estimated at $576,850, approximately $233 per square foot. 20689 Frost Ct is a home located in Dakota County with nearby schools including Meadowview Elementary School, Robert Boeckman Middle School, and Farmington High School.
Ownership History
Date
Name
Owned For
Owner Type
Purchase Details
Closed on
Jan 21, 2010
Sold by
K Michael Homes Llc
Bought by
Berg Michael and Berg Jamie
Current Estimated Value
Home Financials for this Owner
Home Financials are based on the most recent Mortgage that was taken out on this home.
Original Mortgage
$353,148
Outstanding Balance
$233,504
Interest Rate
5.09%
Mortgage Type
VA
Estimated Equity
$343,346
Purchase Details
Closed on
Oct 6, 2009
Sold by
Chase Real Estate Inc
Bought by
Holmes K Michael
Home Financials for this Owner
Home Financials are based on the most recent Mortgage that was taken out on this home.
Original Mortgage
$85,000
Interest Rate
8%
Mortgage Type
Land Contract Argmt. Of Sale
Purchase Details
Closed on
Feb 28, 2008
Sold by
Mattamy Minneapolis Partnership
Bought by
Chase Real Estate Llc
Purchase Details
Closed on
Mar 20, 2006
Sold by
Laukka Jarvis Inc
Bought by
Mattamy Minneapolis Partnership
Create a Home Valuation Report for This Property
The Home Valuation Report is an in-depth analysis detailing your home's value as well as a comparison with similar homes in the area
Home Values in the Area
Average Home Value in this Area
Purchase History
| Date | Buyer | Sale Price | Title Company |
|---|---|---|---|
| Berg Michael | $341,867 | -- | |
| K Michael Homes Llc | $154,000 | -- | |
| Holmes K Michael | $85,000 | -- | |
| Chase Real Estate Llc | $2,442,335 | -- | |
| Mattamy Minneapolis Partnership | $478,800 | -- |
Source: Public Records
Mortgage History
| Date | Status | Borrower | Loan Amount |
|---|---|---|---|
| Open | K Michael Homes Llc | $353,148 | |
| Closed | Berg Michael | $353,148 | |
| Previous Owner | Holmes K Michael | $85,000 |
Source: Public Records
Tax History Compared to Growth
Tax History
| Year | Tax Paid | Tax Assessment Tax Assessment Total Assessment is a certain percentage of the fair market value that is determined by local assessors to be the total taxable value of land and additions on the property. | Land | Improvement |
|---|---|---|---|---|
| 2024 | $5,756 | $517,300 | $121,000 | $396,300 |
| 2023 | $5,756 | $528,700 | $120,700 | $408,000 |
| 2022 | $5,388 | $512,500 | $120,300 | $392,200 |
| 2021 | $5,540 | $427,800 | $104,600 | $323,200 |
| 2020 | $5,668 | $426,000 | $99,600 | $326,400 |
| 2019 | $5,138 | $420,500 | $94,800 | $325,700 |
| 2018 | $4,969 | $381,400 | $93,900 | $287,500 |
| 2017 | $5,028 | $362,400 | $89,400 | $273,000 |
| 2016 | $5,195 | $355,700 | $85,100 | $270,600 |
| 2015 | $4,860 | $348,075 | $81,431 | $266,644 |
| 2014 | -- | $350,146 | $79,211 | $270,935 |
| 2013 | -- | $300,442 | $71,377 | $229,065 |
Source: Public Records
Map
Nearby Homes
- 447 Romeo Dr Unit 323
- 531 Juliet Dr Unit 177
- 438 Romeo Dr Unit 314
- 20338 Gallifrey Way
- 20341 Gadget Cir
- 20325 Gallifrey Way
- 881 MacBeth Cr Unit 276
- 430 Romeo Dr Unit 307
- 613 MacBeth Cr Unit 204
- 884 Macbeth Cir Unit 279
- 925 Hamlet Cir Unit 146
- 513 Juliet Dr Unit 163
- 605 Macbeth Cir Unit 199
- 7167 203rd St W
- 603 Macbeth Cir Unit 198
- 504 Juliet Dr Unit 155
- 503 Juliet Dr Unit 154
- 408 Romeo Dr Unit 287
- 404 Romeo Dr Unit 283
- 731 Juliet Dr Unit 191
- 20685 20685 Frost-Court-
- 20685 Frost Ct
- 20693 Frost Ct
- 20620 Fruitwood Path
- 20624 Fruitwood Path
- 20681 Frost Ct
- 20697 Frost Ct
- 20644 Frost Ct
- 20634 Fruitwood Path
- 20616 Fruitwood Path
- 20686 Frost Ct
- 20690 Frost Ct
- 20682 Frost Ct
- 20694 Frost Ct
- 20677 Frost Ct
- 20612 Fruitwood Path
- 20678 Frost Ct
- 20698 Frost Ct
- 20621 Fruitwood Path
- 20625 Fruitwood Path