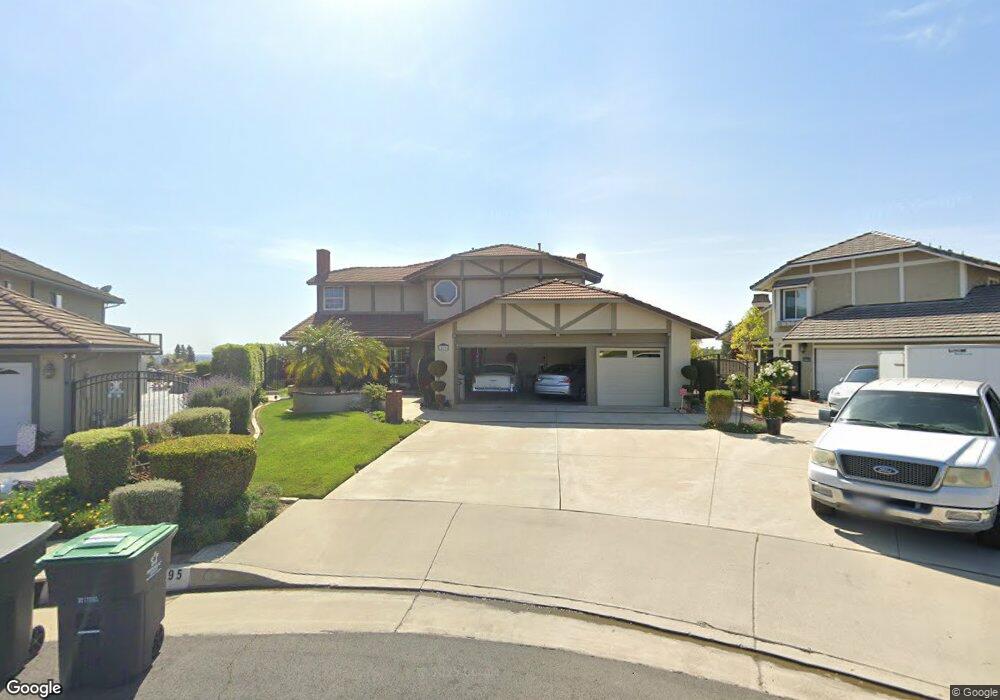
20695 Juniper Ave Yorba Linda, CA 92886
Estimated Value: $1,628,000 - $2,053,000
4
Beds
3
Baths
2,528
Sq Ft
$698/Sq Ft
Est. Value
About This Home
This home is located at 20695 Juniper Ave, Yorba Linda, CA 92886 and is currently estimated at $1,765,012, approximately $698 per square foot. 20695 Juniper Ave is a home located in Orange County with nearby schools including Fairmont Elementary, Bernardo Yorba Middle School, and Yorba Linda High School.
Ownership History
Date
Name
Owned For
Owner Type
Purchase Details
Closed on
May 26, 1995
Sold by
Kaller Doreen
Bought by
Kaller Doreen G
Current Estimated Value
Purchase Details
Closed on
Aug 16, 1993
Sold by
General Electric Mtg Insurance Corp
Bought by
Kaller Doreen
Home Financials for this Owner
Home Financials are based on the most recent Mortgage that was taken out on this home.
Original Mortgage
$200,000
Interest Rate
6.88%
Purchase Details
Closed on
Jul 16, 1993
Sold by
Countrywide Funding Corp
Bought by
General Electric Mtg Insurance Corp
Home Financials for this Owner
Home Financials are based on the most recent Mortgage that was taken out on this home.
Original Mortgage
$200,000
Interest Rate
6.88%
Purchase Details
Closed on
Mar 19, 1993
Sold by
Countrywide Title Corporation
Bought by
Countrywide Funding Corporation
Create a Home Valuation Report for This Property
The Home Valuation Report is an in-depth analysis detailing your home's value as well as a comparison with similar homes in the area
Home Values in the Area
Average Home Value in this Area
Purchase History
| Date | Buyer | Sale Price | Title Company |
|---|---|---|---|
| Kaller Doreen G | -- | -- | |
| Kaller Doreen | $367,500 | First American Title | |
| General Electric Mtg Insurance Corp | -- | First American Title | |
| Countrywide Funding Corporation | $443,154 | Countrywide Title Corporatio |
Source: Public Records
Mortgage History
| Date | Status | Borrower | Loan Amount |
|---|---|---|---|
| Previous Owner | Kaller Doreen | $200,000 |
Source: Public Records
Tax History Compared to Growth
Tax History
| Year | Tax Paid | Tax Assessment Tax Assessment Total Assessment is a certain percentage of the fair market value that is determined by local assessors to be the total taxable value of land and additions on the property. | Land | Improvement |
|---|---|---|---|---|
| 2025 | $7,489 | $624,624 | $301,160 | $323,464 |
| 2024 | $7,489 | $612,377 | $295,255 | $317,122 |
| 2023 | $7,345 | $600,370 | $289,466 | $310,904 |
| 2022 | $7,210 | $588,599 | $283,791 | $304,808 |
| 2021 | $7,002 | $577,058 | $278,226 | $298,832 |
| 2020 | $6,912 | $571,141 | $275,373 | $295,768 |
| 2019 | $6,515 | $559,943 | $269,974 | $289,969 |
| 2018 | $6,396 | $548,964 | $264,680 | $284,284 |
| 2017 | $6,437 | $538,200 | $259,490 | $278,710 |
| 2016 | $6,419 | $527,648 | $254,402 | $273,246 |
| 2015 | $6,342 | $519,723 | $250,581 | $269,142 |
| 2014 | $6,159 | $509,543 | $245,673 | $263,870 |
Source: Public Records
Map
Nearby Homes
- 4152 Beech Ave
- 21590 Via Pepita
- 4090 Naples Ct
- 4080 Naples Ct
- 20681 Via Amarilla
- 4465 San Antonio Rd
- 4418 Avenida Del Este
- 3862 Ravenswood Dr
- 20212 Chianti Ct
- 3635 Banyon Rim Rd
- 21290 Clear Haven Dr
- 4362 Via Alegre
- 3620 Sherwood Dr
- 20100 Livorno Ln
- 20660 Calle Feliz
- 3610 Windsong Cir
- 4545 Avenida Rio Del Oro
- 20000 Villa Torino
- 4066 Villa Quintana
- 4446 Avenida de Las Flores
- 20705 Juniper Ave
- 20726 Juniper Ave
- 4315 Smoketree Ave
- 20715 Juniper Ave
- 20736 Juniper Ave
- 4248 Camphor Ave
- 4232 Camphor Ave
- 4264 Camphor Ave
- 4216 Camphor Ave
- 20725 Juniper Ave
- 20746 Juniper Ave
- 4325 Smoketree Ave
- 20579 Manzanita Ave
- 4200 Camphor Ave
- 20583 Manzanita Ave
- 20573 Manzanita Ave
- 20735 Juniper Ave
- 20589 Manzanita Ave
- 4305 Smoketree Ave
- 4335 Smoketree Ave