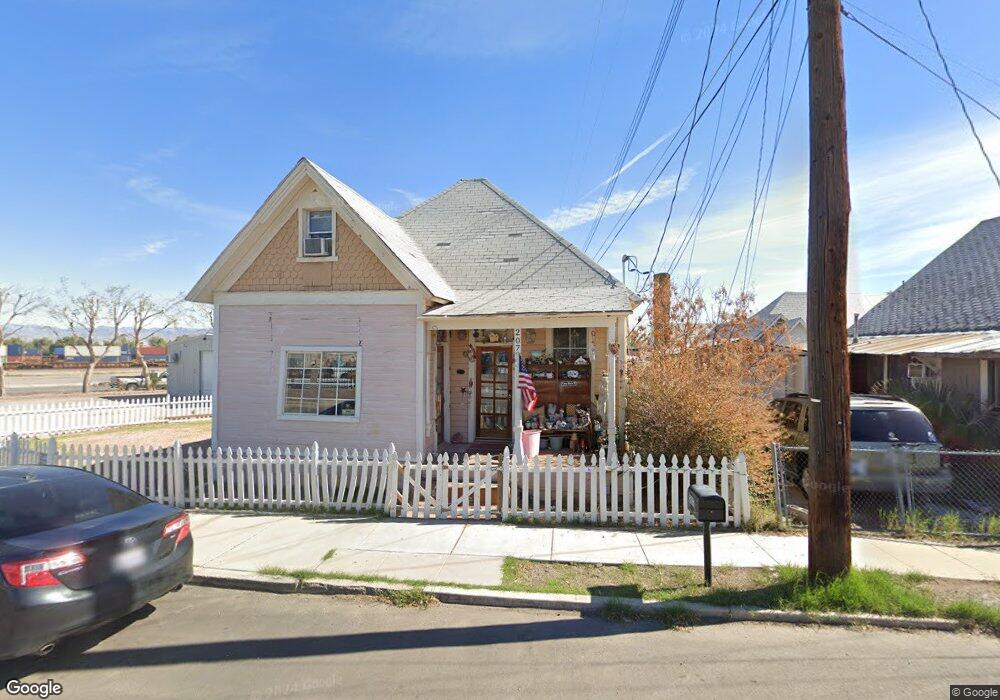
207 B St Needles, CA 92363
Estimated Value: $118,000
2
Beds
1
Bath
1,380
Sq Ft
$86/Sq Ft
Est. Value
About This Home
This home is located at 207 B St, Needles, CA 92363 and is currently estimated at $118,000, approximately $85 per square foot. 207 B St is a home located in San Bernardino County with nearby schools including Vista Colorado Elementary School, Chemehuevi Valley Elementary School, and Needles Middle School.
Ownership History
Date
Name
Owned For
Owner Type
Purchase Details
Closed on
Dec 17, 2015
Sold by
Wilson Melody H
Bought by
Oveson Melody H
Current Estimated Value
Purchase Details
Closed on
Nov 19, 2009
Sold by
Wilson Billy Jack
Bought by
Wilson Melody H
Purchase Details
Closed on
Nov 16, 2009
Sold by
Us Bank National Association
Bought by
Wilson Melody H
Purchase Details
Closed on
Sep 21, 2009
Sold by
Robinson Keith
Bought by
Us Bank National Association
Purchase Details
Closed on
Oct 25, 2003
Sold by
Federal National Mortgage Association
Bought by
Genova Paul F
Purchase Details
Closed on
Apr 9, 2003
Sold by
Givens William B and Givens Myrna J
Bought by
Federal National Mortgage Association
Purchase Details
Closed on
Sep 3, 1998
Sold by
Givens Myrna J
Bought by
Givens Myrna J and Smoot Rena L
Create a Home Valuation Report for This Property
The Home Valuation Report is an in-depth analysis detailing your home's value as well as a comparison with similar homes in the area
Home Values in the Area
Average Home Value in this Area
Purchase History
| Date | Buyer | Sale Price | Title Company |
|---|---|---|---|
| Oveson Melody H | -- | None Available | |
| Wilson Melody H | -- | Lsi Title Company | |
| Wilson Melody H | $26,500 | Lsi Title Company | |
| Us Bank National Association | $25,861 | Accommodation | |
| Genova Paul F | $6,000 | Commonwealth Title | |
| Federal National Mortgage Association | $11,104 | Fidelity National Title | |
| Givens Myrna J | -- | -- |
Source: Public Records
Tax History
| Year | Tax Paid | Tax Assessment Tax Assessment Total Assessment is a certain percentage of the fair market value that is determined by local assessors to be the total taxable value of land and additions on the property. | Land | Improvement |
|---|---|---|---|---|
| 2025 | $555 | $34,207 | $9,037 | $25,170 |
| 2024 | $544 | $33,536 | $8,860 | $24,676 |
| 2023 | $591 | $32,878 | $8,686 | $24,192 |
| 2022 | $578 | $32,234 | $8,516 | $23,718 |
| 2021 | $568 | $31,602 | $8,349 | $23,253 |
| 2020 | $562 | $31,278 | $8,263 | $23,015 |
| 2019 | $565 | $30,665 | $8,101 | $22,564 |
| 2018 | $564 | $30,064 | $7,942 | $22,122 |
| 2017 | $548 | $29,474 | $7,786 | $21,688 |
| 2016 | $502 | $28,896 | $7,633 | $21,263 |
| 2015 | $377 | $28,462 | $7,518 | $20,944 |
| 2014 | $341 | $27,905 | $7,371 | $20,534 |
Source: Public Records
Map
Nearby Homes
Your Personal Tour Guide
Ask me questions while you tour the home.