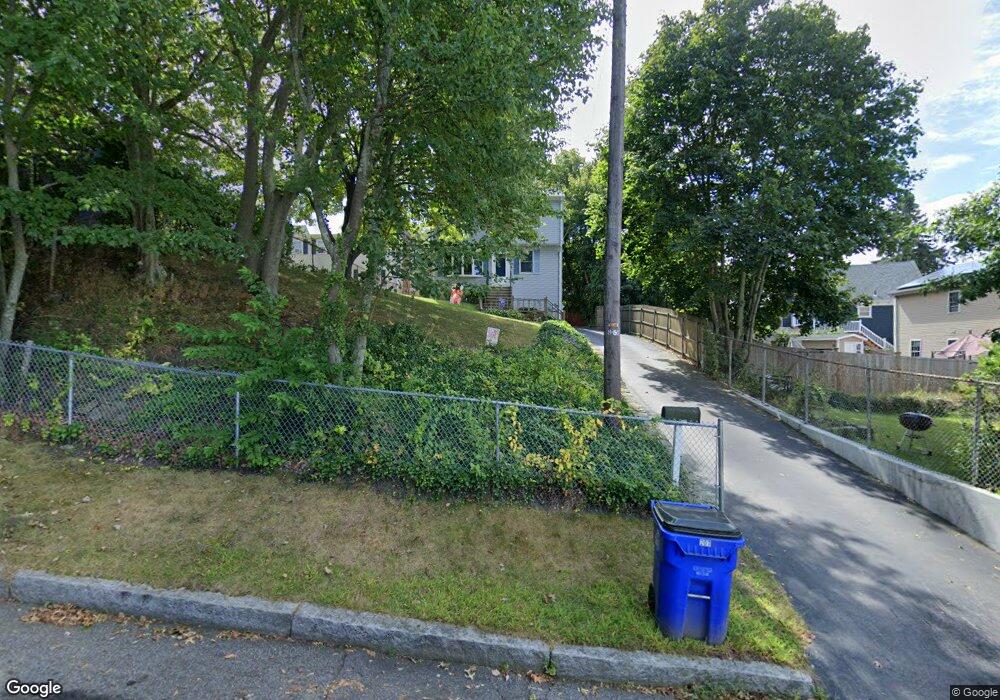
207 Birch St Fall River, MA 02724
Sandy Beach NeighborhoodEstimated Value: $398,000 - $437,000
3
Beds
2
Baths
1,404
Sq Ft
$298/Sq Ft
Est. Value
About This Home
This home is located at 207 Birch St, Fall River, MA 02724 and is currently estimated at $418,317, approximately $297 per square foot. 207 Birch St is a home located in Bristol County with nearby schools including Carlton M. Viveiros Elementary School, Matthew J. Kuss Middle School, and B M C Durfee High School.
Ownership History
Date
Name
Owned For
Owner Type
Purchase Details
Closed on
Oct 25, 2023
Sold by
Choquette Rory A and Zmuda Laurie
Bought by
Choquette Choquette T T and Choquette Zmuda
Current Estimated Value
Purchase Details
Closed on
Jul 3, 2002
Sold by
Family Homes Constr Co
Bought by
Choquette Rory and Zmuda Laurie
Home Financials for this Owner
Home Financials are based on the most recent Mortgage that was taken out on this home.
Original Mortgage
$116,250
Interest Rate
6.82%
Mortgage Type
Purchase Money Mortgage
Purchase Details
Closed on
Apr 11, 2002
Sold by
Camara Charles P and Camara Marie A
Bought by
Family Homes Const Co
Home Financials for this Owner
Home Financials are based on the most recent Mortgage that was taken out on this home.
Original Mortgage
$130,000
Interest Rate
7.05%
Create a Home Valuation Report for This Property
The Home Valuation Report is an in-depth analysis detailing your home's value as well as a comparison with similar homes in the area
Home Values in the Area
Average Home Value in this Area
Purchase History
| Date | Buyer | Sale Price | Title Company |
|---|---|---|---|
| Choquette Choquette T T | -- | None Available | |
| Choquette Rory | $175,000 | -- | |
| Family Homes Const Co | $60,500 | -- |
Source: Public Records
Mortgage History
| Date | Status | Borrower | Loan Amount |
|---|---|---|---|
| Previous Owner | Family Homes Const Co | $116,250 | |
| Previous Owner | Family Homes Const Co | $116,250 | |
| Previous Owner | Family Homes Const Co | $130,000 |
Source: Public Records
Tax History
| Year | Tax Paid | Tax Assessment Tax Assessment Total Assessment is a certain percentage of the fair market value that is determined by local assessors to be the total taxable value of land and additions on the property. | Land | Improvement |
|---|---|---|---|---|
| 2025 | $4,257 | $371,800 | $117,800 | $254,000 |
| 2024 | $3,577 | $311,300 | $115,500 | $195,800 |
| 2023 | $3,546 | $289,000 | $104,100 | $184,900 |
| 2022 | $3,466 | $283,100 | $98,200 | $184,900 |
| 2021 | $3,466 | $250,600 | $93,800 | $156,800 |
| 2020 | $2,847 | $197,000 | $89,500 | $107,500 |
| 2019 | $2,917 | $200,100 | $93,600 | $106,500 |
| 2018 | $2,806 | $191,900 | $94,200 | $97,700 |
| 2017 | $2,713 | $193,800 | $94,200 | $99,600 |
| 2016 | $2,609 | $191,400 | $97,100 | $94,300 |
| 2015 | $2,681 | $205,000 | $97,100 | $107,900 |
| 2014 | $2,579 | $205,000 | $97,100 | $107,900 |
Source: Public Records
Map
Nearby Homes
- 245 Dwelly St
- 609 King Philip St
- 616 Woodman St
- 24 Valley St
- 1852 S Main St
- 1846 S Main St
- 126 Wheeler St
- 15 Higgins St
- 57 Larouche St
- 2229 S Main St
- 20 Wilcox St
- 234 Kilburn St
- 917 Dwelly St
- 579 Summit St Unit 3
- 579 Summit St Unit 2
- 1334 S Main St
- 30 Broad St
- 391 Clarkson St
- 1273-1279 S Main St
- 344-354 E Main St
Your Personal Tour Guide
Ask me questions while you tour the home.