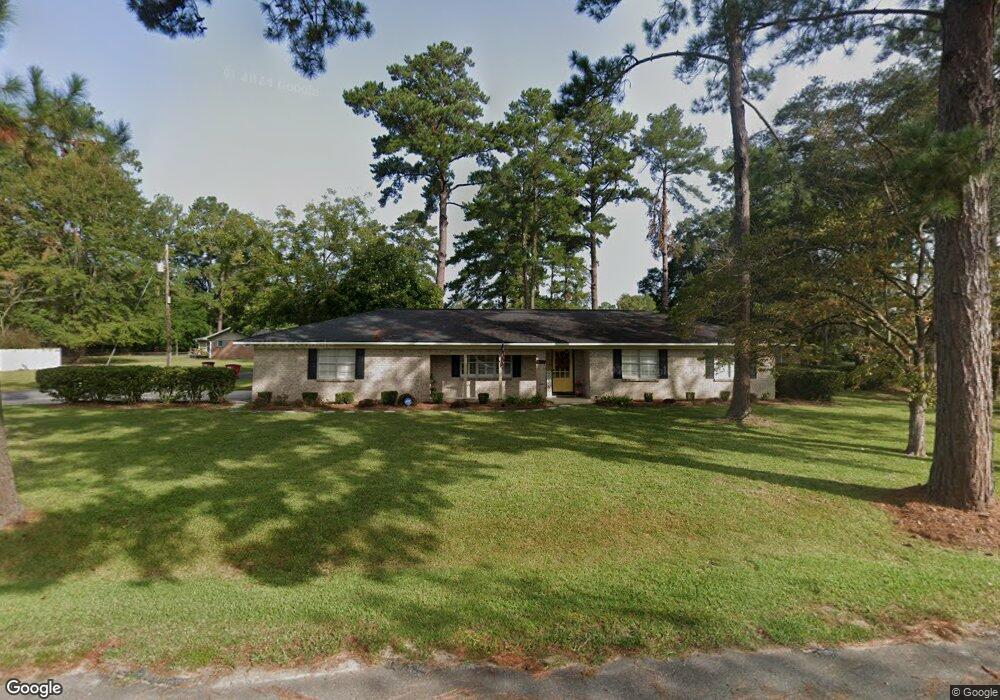
207 Burney Branch Cir Blackshear, GA 31516
Estimated Value: $237,499 - $269,000
3
Beds
2
Baths
1,564
Sq Ft
$160/Sq Ft
Est. Value
About This Home
This home is located at 207 Burney Branch Cir, Blackshear, GA 31516 and is currently estimated at $250,625, approximately $160 per square foot. 207 Burney Branch Cir is a home located in Pierce County with nearby schools including Pierce County High School, Southeast Christian Academy, and Truth Christian Academy.
Ownership History
Date
Name
Owned For
Owner Type
Purchase Details
Closed on
Feb 20, 2019
Sold by
Jacobs Scruggs Jennifer
Bought by
Hunter Edward S and Hunter Kathy A
Current Estimated Value
Purchase Details
Closed on
Jul 11, 2016
Sold by
Naylor Roger
Bought by
Scruggs Jennifer Jacobs
Home Financials for this Owner
Home Financials are based on the most recent Mortgage that was taken out on this home.
Original Mortgage
$122,735
Interest Rate
3.87%
Mortgage Type
FHA
Purchase Details
Closed on
Mar 12, 2001
Sold by
Fey Thomas F and Fey Martha D
Bought by
Naylor Roger and Naylor Kandy
Purchase Details
Closed on
Apr 8, 1996
Sold by
Tyre C J
Bought by
Fey Thomas F and Fey Martha D
Purchase Details
Closed on
Feb 18, 1971
Sold by
Strickland Carswell T
Bought by
Tyre C J
Create a Home Valuation Report for This Property
The Home Valuation Report is an in-depth analysis detailing your home's value as well as a comparison with similar homes in the area
Home Values in the Area
Average Home Value in this Area
Purchase History
| Date | Buyer | Sale Price | Title Company |
|---|---|---|---|
| Hunter Edward S | $144,000 | -- | |
| Scruggs Jennifer Jacobs | $125,000 | -- | |
| Naylor Roger | $72,000 | -- | |
| Fey Thomas F | $71,000 | -- | |
| Tyre C J | -- | -- |
Source: Public Records
Mortgage History
| Date | Status | Borrower | Loan Amount |
|---|---|---|---|
| Previous Owner | Scruggs Jennifer Jacobs | $122,735 |
Source: Public Records
Tax History Compared to Growth
Tax History
| Year | Tax Paid | Tax Assessment Tax Assessment Total Assessment is a certain percentage of the fair market value that is determined by local assessors to be the total taxable value of land and additions on the property. | Land | Improvement |
|---|---|---|---|---|
| 2024 | $1,985 | $82,780 | $6,480 | $76,300 |
| 2023 | $1,984 | $82,569 | $6,480 | $76,089 |
| 2022 | $1,990 | $60,475 | $7,225 | $53,250 |
| 2021 | $2,125 | $58,556 | $7,225 | $51,331 |
| 2020 | $2,129 | $56,637 | $7,225 | $49,412 |
| 2019 | $1,919 | $46,351 | $7,225 | $39,126 |
| 2018 | $1,837 | $44,253 | $7,225 | $37,028 |
| 2017 | $1,798 | $43,187 | $7,225 | $35,962 |
| 2016 | $1,635 | $40,772 | $7,225 | $33,547 |
| 2015 | $1,479 | $40,772 | $7,225 | $33,547 |
| 2014 | $1,479 | $40,772 | $7,225 | $33,547 |
| 2013 | $1,479 | $40,772 | $7,225 | $33,547 |
Source: Public Records
Map
Nearby Homes
- 1114 Laurel St
- 1207 College Ave
- 1120 College Ave
- 930 Burney Branch Cir
- 118 Pinehurst Dr
- 209 Woodlawn Terrace
- 113 Tatum Ln
- 915 Jane St
- 936 Azalea St
- 933 Azalea St
- 4023 Maple Rd
- 5605 Ga Highway 121
- 854 Jenkins St
- 622 E Main St
- 111 Cedar Ln
- 706 Jenkins St
- 0001 Georgia 121
- ST. ROUTE 121 Georgia 121
- 3930 Golfview Dr
- 835 Azalea St
- 1109 Laurel St
- 129 Burney Branch Cir
- 310 Burney Branch Cir
- 214 Burney Branch Cir
- 334 Burney Branch Cir
- 204 Rankin Place
- 136 Burney Branch Cir
- 421 Burney Branch Cir
- 333 Burney Branch Cir
- 214 Rankin Place
- 123 Burney Branch Cir
- 1224 Lakeview Dr
- 203 Rankin Place
- 1232 Lakeview Dr
- 124 Burney Branch Cir
- 223 Rankin Place
- 342 Burney Branch Cir
- 137 Lakeview Dr
- 1107 College Ave
- 218 Glenwood Dr