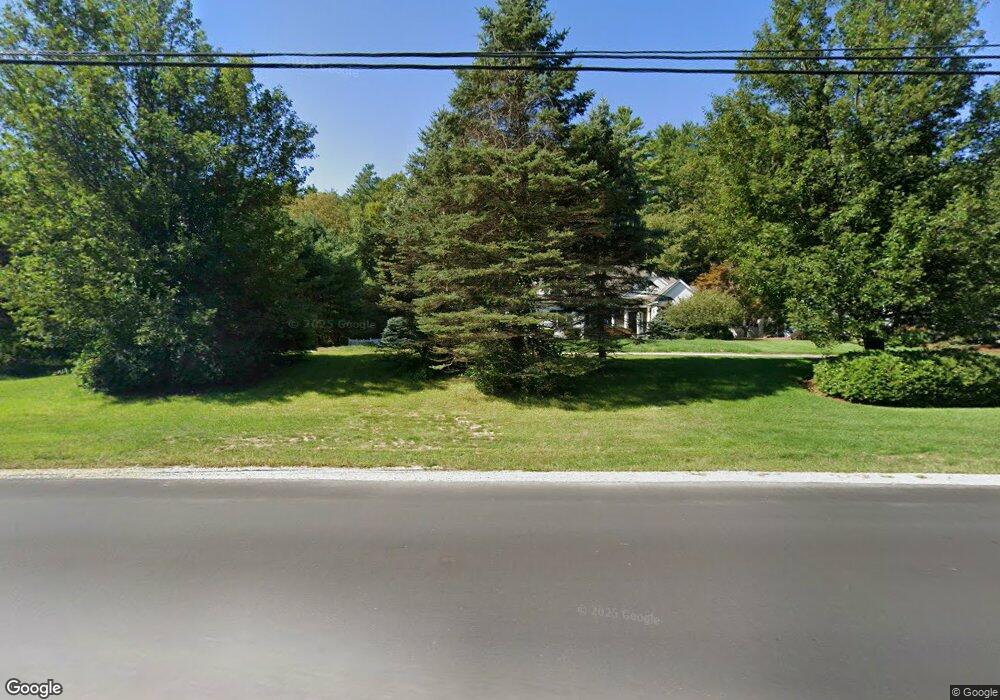
207 Depot Rd Hollis, NH 03049
Hollis NeighborhoodEstimated Value: $837,000 - $1,261,000
4
Beds
3
Baths
2,789
Sq Ft
$363/Sq Ft
Est. Value
About This Home
This home is located at 207 Depot Rd, Hollis, NH 03049 and is currently estimated at $1,011,381, approximately $362 per square foot. 207 Depot Rd is a home with nearby schools including Hollis Primary School, Hollis Upper Elementary School, and Hollis-Brookline Middle School.
Ownership History
Date
Name
Owned For
Owner Type
Purchase Details
Closed on
Feb 16, 2005
Sold by
White Fam Ventures Llc
Bought by
Eanes R Sterling R and Eanes Laura H
Current Estimated Value
Home Financials for this Owner
Home Financials are based on the most recent Mortgage that was taken out on this home.
Original Mortgage
$350,000
Outstanding Balance
$178,251
Interest Rate
5.78%
Mortgage Type
Purchase Money Mortgage
Estimated Equity
$833,130
Create a Home Valuation Report for This Property
The Home Valuation Report is an in-depth analysis detailing your home's value as well as a comparison with similar homes in the area
Home Values in the Area
Average Home Value in this Area
Purchase History
| Date | Buyer | Sale Price | Title Company |
|---|---|---|---|
| Eanes R Sterling R | $660,000 | -- | |
| Eanes R Sterling R | $660,000 | -- |
Source: Public Records
Mortgage History
| Date | Status | Borrower | Loan Amount |
|---|---|---|---|
| Open | Eanes R Sterling R | $134,482 | |
| Open | Eanes R Sterling R | $350,000 | |
| Closed | Eanes R Sterling R | $350,000 |
Source: Public Records
Tax History Compared to Growth
Tax History
| Year | Tax Paid | Tax Assessment Tax Assessment Total Assessment is a certain percentage of the fair market value that is determined by local assessors to be the total taxable value of land and additions on the property. | Land | Improvement |
|---|---|---|---|---|
| 2024 | $12,651 | $713,560 | $261,160 | $452,400 |
| 2023 | $11,890 | $713,667 | $261,267 | $452,400 |
| 2022 | $16,107 | $713,667 | $261,267 | $452,400 |
| 2021 | $10,019 | $441,368 | $173,868 | $267,500 |
| 2020 | $10,231 | $441,368 | $173,868 | $267,500 |
| 2019 | $5,092 | $441,357 | $173,857 | $267,500 |
| 2018 | $5,664 | $441,402 | $173,902 | $267,500 |
| 2017 | $4,779 | $381,845 | $155,545 | $226,300 |
| 2016 | $5,362 | $381,845 | $155,545 | $226,300 |
| 2015 | $8,790 | $381,845 | $155,545 | $226,300 |
| 2014 | $8,832 | $381,845 | $155,545 | $226,300 |
| 2013 | $8,715 | $381,917 | $155,617 | $226,300 |
Source: Public Records
Map
Nearby Homes