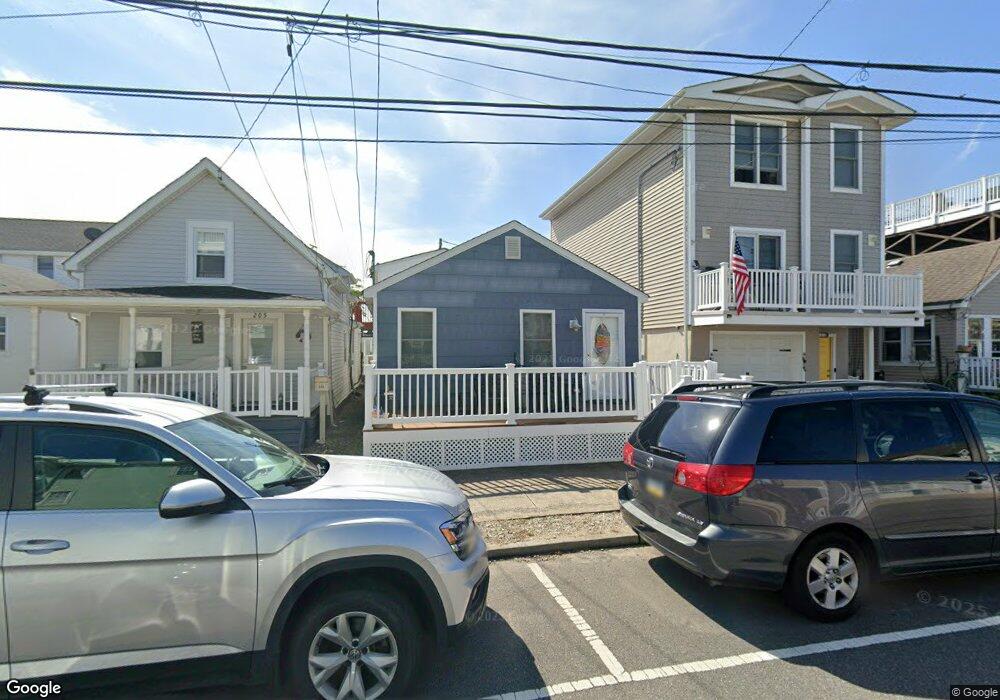
207 Dupont Ave Seaside Heights, NJ 08751
Estimated Value: $416,630 - $551,000
3
Beds
1
Bath
640
Sq Ft
$764/Sq Ft
Est. Value
About This Home
This home is located at 207 Dupont Ave, Seaside Heights, NJ 08751 and is currently estimated at $489,158, approximately $764 per square foot. 207 Dupont Ave is a home located in Ocean County with nearby schools including Hugh J. Boyd Jr. Elementary School, Central Regional Middle School, and Central Regional High School.
Ownership History
Date
Name
Owned For
Owner Type
Purchase Details
Closed on
Aug 30, 2007
Sold by
Bopp Joseph M and Battis Bopp Jane P
Bought by
Taubel Catharine and Taubel William F
Current Estimated Value
Home Financials for this Owner
Home Financials are based on the most recent Mortgage that was taken out on this home.
Original Mortgage
$266,000
Outstanding Balance
$168,930
Interest Rate
6.63%
Mortgage Type
Purchase Money Mortgage
Estimated Equity
$320,228
Purchase Details
Closed on
Jan 6, 2005
Sold by
Nero Lance
Bought by
Bopp Joseph M
Home Financials for this Owner
Home Financials are based on the most recent Mortgage that was taken out on this home.
Original Mortgage
$230,000
Interest Rate
6.12%
Mortgage Type
New Conventional
Purchase Details
Closed on
Feb 3, 2004
Sold by
Laurenzi David A
Bought by
Nero Lance
Home Financials for this Owner
Home Financials are based on the most recent Mortgage that was taken out on this home.
Original Mortgage
$142,000
Interest Rate
5.8%
Create a Home Valuation Report for This Property
The Home Valuation Report is an in-depth analysis detailing your home's value as well as a comparison with similar homes in the area
Home Values in the Area
Average Home Value in this Area
Purchase History
| Date | Buyer | Sale Price | Title Company |
|---|---|---|---|
| Taubel Catharine | $280,000 | Transnation Title Ins Co | |
| Bopp Joseph M | $245,000 | None Available | |
| Nero Lance | $177,500 | -- |
Source: Public Records
Mortgage History
| Date | Status | Borrower | Loan Amount |
|---|---|---|---|
| Open | Taubel Catharine | $266,000 | |
| Previous Owner | Bopp Joseph M | $230,000 | |
| Previous Owner | Nero Lance | $142,000 |
Source: Public Records
Tax History Compared to Growth
Tax History
| Year | Tax Paid | Tax Assessment Tax Assessment Total Assessment is a certain percentage of the fair market value that is determined by local assessors to be the total taxable value of land and additions on the property. | Land | Improvement |
|---|---|---|---|---|
| 2025 | $3,866 | $381,600 | $287,500 | $94,100 |
| 2024 | $3,587 | $136,400 | $81,300 | $55,100 |
| 2023 | $3,411 | $136,400 | $81,300 | $55,100 |
| 2022 | $3,411 | $136,400 | $81,300 | $55,100 |
| 2021 | $3,301 | $136,400 | $81,300 | $55,100 |
| 2020 | $3,312 | $136,400 | $81,300 | $55,100 |
| 2019 | $3,212 | $136,400 | $81,300 | $55,100 |
| 2018 | $3,128 | $136,400 | $81,300 | $55,100 |
| 2017 | $3,069 | $136,400 | $81,300 | $55,100 |
| 2016 | $3,017 | $136,400 | $81,300 | $55,100 |
| 2015 | $2,912 | $136,400 | $81,300 | $55,100 |
| 2014 | $2,667 | $136,400 | $81,300 | $55,100 |
Source: Public Records
Map
Nearby Homes
- 3 E Central Ave
- 235 Bay Terrace Unit A
- 235A Bay Terrace Unit A
- 45-55 Dupont Ave
- 111 Dupont Ave
- 119 Dupont Ave Unit 10
- 1 Boulevard Unit G
- 121 Lincoln Ave Unit 25
- 125 Lincoln Ave
- 1912 Boulevard
- 305 Franklin Ave
- 57 Dupont Ave
- 214 Franklin Ave
- 1705 N Bayview Ave
- 8 Bay Blvd Unit 1
- 134 Franklin Ave
- 322 Lincoln Ave
- 303 Hamilton Ave
- 305 Hamilton Ave
- 43 Lincoln Ave
- 211 Dupont Ave
- 205 Dupont Ave
- 209 Dupont Ave
- 201 Dupont Ave Unit 203
- 210 Bay Terrace
- 213 Dupont Ave
- 208 Bay Terrace
- 214 Bay Terrace
- 215 Dupont Ave
- 216 Bay Terrace
- 209 Bay Terrace
- 205 Bay Terrace
- 208 Dupont Ave
- 217 Dupont Ave
- 211 Bay Terrace
- 210 Dupont Ave
- 201 Bay Terrace
- 201 Bay Terrace Unit A
- 201 Bay Terrace Unit B
- 212 Dupont Ave