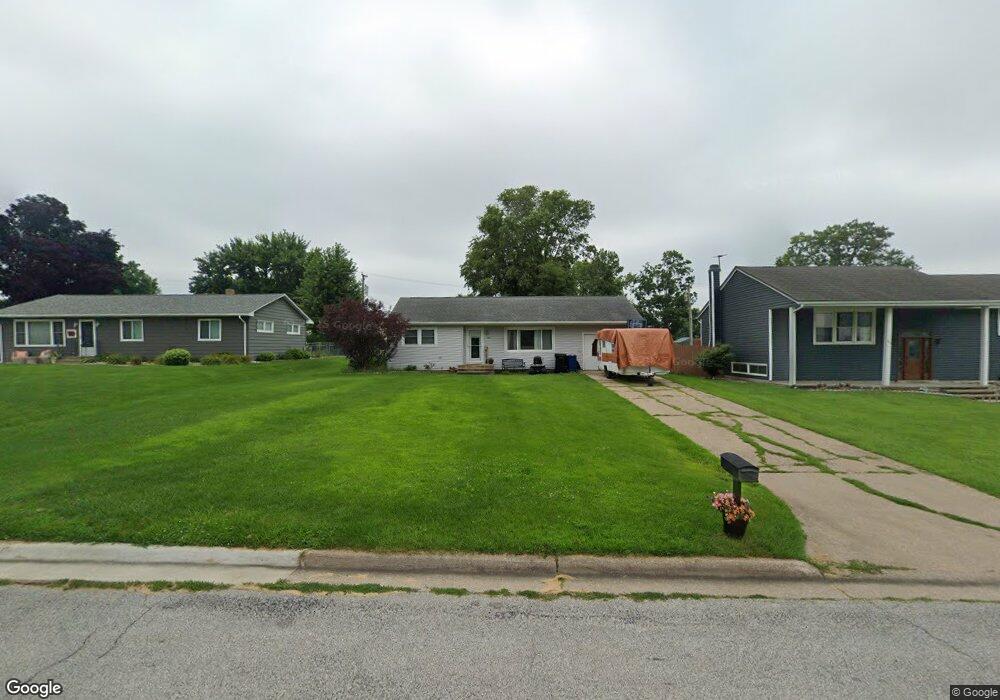
207 E 13th St Tipton, IA 52772
Estimated Value: $137,687 - $172,000
2
Beds
2
Baths
892
Sq Ft
$177/Sq Ft
Est. Value
About This Home
This home is located at 207 E 13th St, Tipton, IA 52772 and is currently estimated at $157,672, approximately $176 per square foot. 207 E 13th St is a home located in Cedar County with nearby schools including Tipton Elementary School, Tipton Middle School, and Tipton High School.
Ownership History
Date
Name
Owned For
Owner Type
Purchase Details
Closed on
Mar 28, 2022
Sold by
Scott Tenley
Bought by
Tenley Tricia L
Current Estimated Value
Purchase Details
Closed on
Oct 26, 2012
Sold by
Tenley Scott and Young Tricia L
Bought by
Tenley Scott Howard and Tenley Tricia Lynn
Home Financials for this Owner
Home Financials are based on the most recent Mortgage that was taken out on this home.
Original Mortgage
$82,570
Interest Rate
3.39%
Mortgage Type
FHA
Create a Home Valuation Report for This Property
The Home Valuation Report is an in-depth analysis detailing your home's value as well as a comparison with similar homes in the area
Home Values in the Area
Average Home Value in this Area
Purchase History
| Date | Buyer | Sale Price | Title Company |
|---|---|---|---|
| Tenley Tricia L | -- | None Listed On Document | |
| Tenley Scott Howard | -- | None Available |
Source: Public Records
Mortgage History
| Date | Status | Borrower | Loan Amount |
|---|---|---|---|
| Previous Owner | Tenley Scott Howard | $82,570 |
Source: Public Records
Tax History
| Year | Tax Paid | Tax Assessment Tax Assessment Total Assessment is a certain percentage of the fair market value that is determined by local assessors to be the total taxable value of land and additions on the property. | Land | Improvement |
|---|---|---|---|---|
| 2025 | $2,294 | $148,780 | $25,590 | $123,190 |
| 2024 | $2,294 | $137,690 | $25,590 | $112,100 |
| 2023 | $2,132 | $134,190 | $25,590 | $108,600 |
| 2022 | $1,944 | $107,820 | $21,660 | $86,160 |
| 2021 | $1,818 | $107,820 | $21,660 | $86,160 |
| 2020 | $1,708 | $103,030 | $21,660 | $81,370 |
| 2019 | $1,796 | $105,510 | $0 | $0 |
| 2018 | $1,740 | $105,510 | $0 | $0 |
| 2017 | $1,740 | $94,060 | $0 | $0 |
| 2016 | $1,572 | $94,060 | $0 | $0 |
| 2015 | $1,604 | $93,290 | $0 | $0 |
| 2014 | $1,574 | $93,290 | $0 | $0 |
Source: Public Records
Map
Nearby Homes
- 1210 North Ave
- 111 W 11th St
- 910 Meridian St
- 908 Lynn St
- 1007 Parkview Dr
- 1310 Plum St
- 108 Parkview Ct
- 4 Lot Parkview Ln
- 10 Lots Parkview Dr
- 506 W 9th St
- 2 Lot Parkview Ln
- 1 Lot Parkview Ln
- 0 Lynn St
- 3 Lot Parkview Ln
- 1105 Highway 38
- 1105 Iowa 38
- 5 Lot Parkview Ln
- 9 Lot Parkview Ln
- 8 Lot Parkview Ln
- 6 Lot Parkview Ln
Your Personal Tour Guide
Ask me questions while you tour the home.