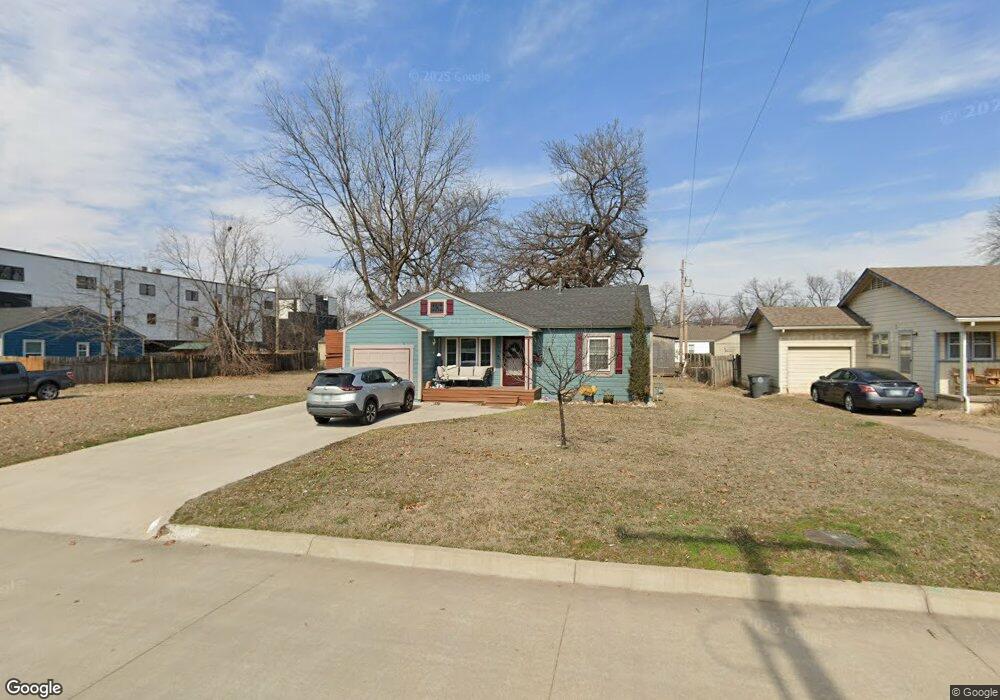
207 E 38th Place Tulsa, OK 74105
Brookside NeighborhoodEstimated Value: $212,417 - $273,000
Studio
1
Bath
1,031
Sq Ft
$239/Sq Ft
Est. Value
About This Home
This home is located at 207 E 38th Place, Tulsa, OK 74105 and is currently estimated at $246,604, approximately $239 per square foot. 207 E 38th Place is a home located in Tulsa County with nearby schools including Eliot Elementary School, Edison Preparatory School, and Thomas Edison Preparatory High School.
Ownership History
Date
Name
Owned For
Owner Type
Purchase Details
Closed on
Nov 3, 2023
Sold by
Bower Sarah Christine and Bower Bryce D
Bought by
Bower Family Trust and Bower
Current Estimated Value
Purchase Details
Closed on
Apr 27, 2021
Sold by
Bower Sarah Christine and Bower Bryce D
Bought by
Bower Sarah Christine and Bower Bryce D
Purchase Details
Closed on
Sep 8, 2020
Sold by
Boomtown Properties Llc
Bought by
Bower Sarah Christine
Home Financials for this Owner
Home Financials are based on the most recent Mortgage that was taken out on this home.
Original Mortgage
$144,000
Interest Rate
2.9%
Mortgage Type
Future Advance Clause Open End Mortgage
Purchase Details
Closed on
Aug 16, 2019
Sold by
Raln Llc
Bought by
Bower Sarah and Bower Bryce
Home Financials for this Owner
Home Financials are based on the most recent Mortgage that was taken out on this home.
Original Mortgage
$118,400
Interest Rate
3.7%
Mortgage Type
New Conventional
Purchase Details
Closed on
Aug 1, 1989
Create a Home Valuation Report for This Property
The Home Valuation Report is an in-depth analysis detailing your home's value as well as a comparison with similar homes in the area
Home Values in the Area
Average Home Value in this Area
Purchase History
| Date | Buyer | Sale Price | Title Company |
|---|---|---|---|
| Bower Family Trust | -- | None Listed On Document | |
| Bower Sarah Christine | -- | None Listed On Document | |
| Bower Sarah Christine | $180,000 | Aspen Closing & Title | |
| Bower Sarah | $148,000 | True Title & Escrow Inc | |
| -- | $22,000 | -- |
Source: Public Records
Mortgage History
| Date | Status | Borrower | Loan Amount |
|---|---|---|---|
| Previous Owner | Bower Sarah Christine | $144,000 | |
| Previous Owner | Bower Sarah | $118,400 |
Source: Public Records
Tax History
| Year | Tax Paid | Tax Assessment Tax Assessment Total Assessment is a certain percentage of the fair market value that is determined by local assessors to be the total taxable value of land and additions on the property. | Land | Improvement |
|---|---|---|---|---|
| 2025 | $3,112 | $23,223 | $8,375 | $14,848 |
| 2024 | $2,797 | $22,117 | $9,422 | $12,695 |
| 2023 | $2,797 | $22,040 | $8,092 | $13,948 |
| 2022 | $2,799 | $20,991 | $9,422 | $11,569 |
| 2021 | $2,150 | $16,280 | $4,711 | $11,569 |
| 2020 | $2,121 | $16,280 | $4,711 | $11,569 |
| 2019 | $1,301 | $9,497 | $4,121 | $5,376 |
| 2018 | $1,242 | $9,045 | $3,925 | $5,120 |
| 2017 | $1,181 | $8,614 | $3,738 | $4,876 |
| 2016 | $1,101 | $8,204 | $3,716 | $4,488 |
| 2015 | $1,051 | $9,630 | $4,362 | $5,268 |
| 2014 | $991 | $9,630 | $4,362 | $5,268 |
Source: Public Records
Map
Nearby Homes
- 3779 Riverside Dr Unit 3779
- 3777 Riverside Dr Unit 3777
- 3783 Riverside Dr Unit 3783
- 3773 Riverside Dr Unit 3773
- 3769 Riverside Dr Unit 3769
- 3755 Riverside Dr Unit 3755
- 3767 Riverside Dr Unit 3767
- 3758 S Madison Ave Unit 5
- 3701 Riverside Dr Unit 14
- 3701 Riverside Dr Unit 6
- 3701 Riverside Dr Unit 12
- 1009 E 38th St
- 913 E 37th St
- 3921 S Madison Ave
- 3947 S Madison Ave
- 1004 E 36th St
- 4127 S Cincinnati Ave
- 4134 S Detroit Ave
- 227 E 35th Place
- 1031 E 36th St
- 211 E 38th Place
- 203 E 38th Place
- 113 E 38th Place
- 920 E 37th Place
- 924 E 37th Place
- 3815 S Cincinnati Ave
- 914 E 37th Place
- 3816 S Detroit Ave
- 932 E 37th Place
- 109 E 38th Place
- 221 E 38th Place
- 930 E 37th Place
- 3781 Riverside Dr Unit 3781
- 3819 S Cincinnati Ave
- 3771 Riverside Dr Unit 3771
- 3775 Riverside Dr Unit 3775
- 3820 S Detroit Ave
- 3749 Riverside Dr Unit 1
- 3749 Riverside Dr Unit 3749
- 934 E 37th Place
Your Personal Tour Guide
Ask me questions while you tour the home.