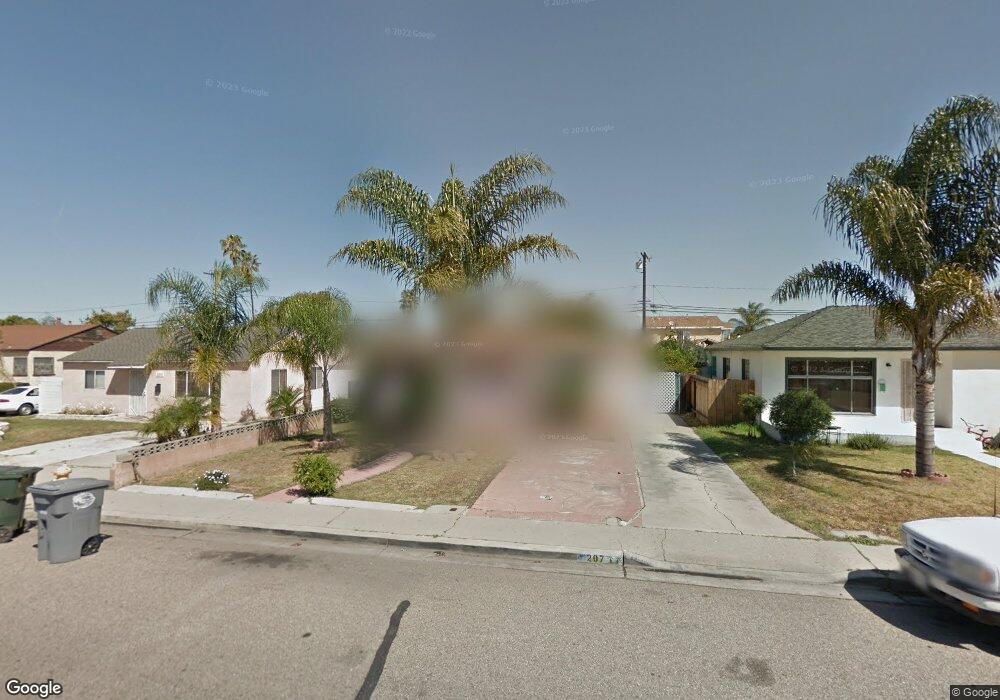
207 E Elm St Oxnard, CA 93033
Cal-Gisler NeighborhoodEstimated Value: $607,000 - $659,000
3
Beds
1
Bath
1,268
Sq Ft
$503/Sq Ft
Est. Value
About This Home
This home is located at 207 E Elm St, Oxnard, CA 93033 and is currently estimated at $637,972, approximately $503 per square foot. 207 E Elm St is a home located in Ventura County with nearby schools including Elm Street Elementary School, R.J. Frank Academy of Marine Science & Engineering, and Santa Clara High School.
Ownership History
Date
Name
Owned For
Owner Type
Purchase Details
Closed on
Oct 19, 2023
Sold by
Vegas Charles E and Vegas Martha A
Bought by
Vegas Family Living Trust and Vegas
Current Estimated Value
Purchase Details
Closed on
Feb 1, 1994
Sold by
Arenas Adele and Vegas Charles E
Bought by
Vegas Charles E and Vegas Martha A
Home Financials for this Owner
Home Financials are based on the most recent Mortgage that was taken out on this home.
Original Mortgage
$105,000
Interest Rate
6.98%
Create a Home Valuation Report for This Property
The Home Valuation Report is an in-depth analysis detailing your home's value as well as a comparison with similar homes in the area
Home Values in the Area
Average Home Value in this Area
Purchase History
| Date | Buyer | Sale Price | Title Company |
|---|---|---|---|
| Vegas Family Living Trust | -- | None Listed On Document | |
| Vegas Charles E | -- | First American Title Ins Co |
Source: Public Records
Mortgage History
| Date | Status | Borrower | Loan Amount |
|---|---|---|---|
| Previous Owner | Vegas Charles E | $105,000 |
Source: Public Records
Tax History
| Year | Tax Paid | Tax Assessment Tax Assessment Total Assessment is a certain percentage of the fair market value that is determined by local assessors to be the total taxable value of land and additions on the property. | Land | Improvement |
|---|---|---|---|---|
| 2025 | $728 | $63,331 | $20,941 | $42,390 |
| 2024 | $728 | $62,090 | $20,531 | $41,559 |
| 2023 | $701 | $60,873 | $20,128 | $40,745 |
| 2022 | $679 | $59,680 | $19,733 | $39,947 |
| 2021 | $673 | $58,510 | $19,346 | $39,164 |
| 2020 | $683 | $57,912 | $19,149 | $38,763 |
| 2019 | $663 | $56,777 | $18,774 | $38,003 |
| 2018 | $653 | $55,664 | $18,406 | $37,258 |
| 2017 | $620 | $54,574 | $18,046 | $36,528 |
| 2016 | $598 | $53,505 | $17,693 | $35,812 |
| 2015 | $603 | $52,703 | $17,428 | $35,275 |
| 2014 | $595 | $51,673 | $17,088 | $34,585 |
Source: Public Records
Map
Nearby Homes
- 225 W Iris St
- 1239 S C St
- 1127 S C St
- 2024 S J St
- 865 S B St Unit Q1
- 819 S B St Unit 34
- 633 Meta St
- 1030 Ilena St
- 3151 Fournier St
- 3130 Paula St
- 2151 E Wooley Rd
- 603 S G St
- 550 S G St
- 1431 Casa San Carlos Ln Unit B
- 807 Kingfisher Way
- 1174 Oyster Place Unit 15
- 3631 La Costa Place
- 1501 Pisco Ln
- 3638 S B St
- 1231 Lost Point Ln
Your Personal Tour Guide
Ask me questions while you tour the home.