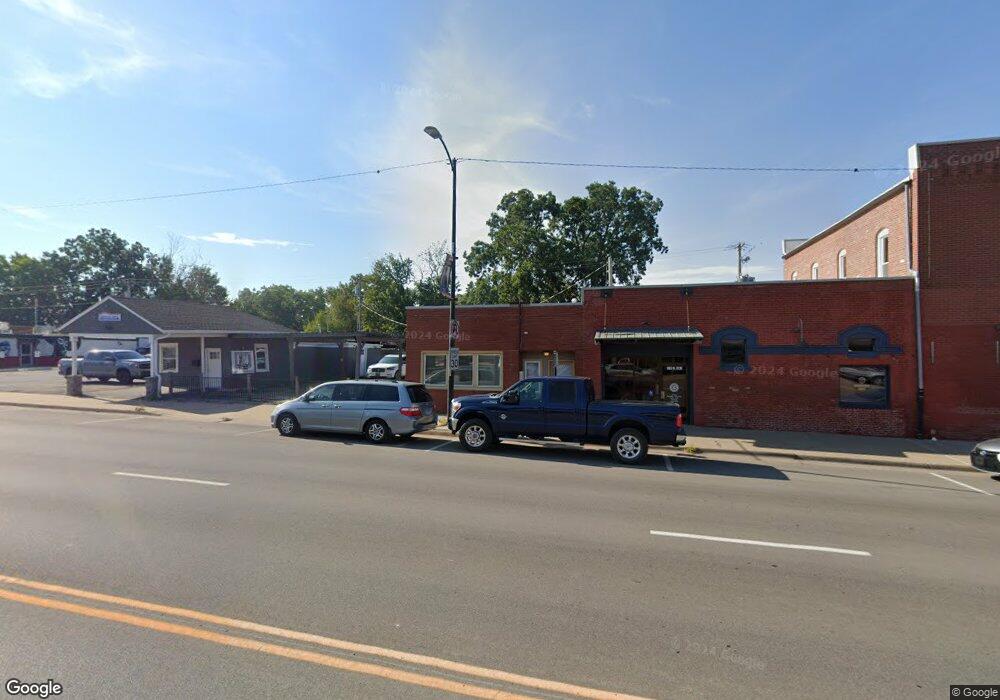
207 E Main St Gardner, KS 66030
Gardner-Edgerton NeighborhoodEstimated Value: $219,724
Studio
--
Bath
1,150
Sq Ft
$191/Sq Ft
Est. Value
About This Home
This home is located at 207 E Main St, Gardner, KS 66030 and is currently priced at $219,724, approximately $191 per square foot. 207 E Main St is a home located in Johnson County with nearby schools including Gardner Elementary School, Wheatridge Middle School, and Gardner Edgerton High School.
Ownership History
Date
Name
Owned For
Owner Type
Purchase Details
Closed on
Mar 7, 2019
Sold by
Brian R & Jean E Bickford Living Trust
Bought by
Three Willow Llc
Current Estimated Value
Purchase Details
Closed on
Feb 15, 2013
Sold by
Bickford Jean and Bickford Brian
Bought by
Bickford Brian R and Bickford Jean E
Purchase Details
Closed on
Nov 9, 2011
Sold by
Stockton Development Company Llc
Bought by
Bickford Brian and Bickford Jean
Home Financials for this Owner
Home Financials are based on the most recent Mortgage that was taken out on this home.
Original Mortgage
$80,500
Interest Rate
4.08%
Mortgage Type
Future Advance Clause Open End Mortgage
Purchase Details
Closed on
Aug 20, 2001
Sold by
Alsup Larry S and Alsup Jacki M
Bought by
Stockton Development Company Llc
Home Financials for this Owner
Home Financials are based on the most recent Mortgage that was taken out on this home.
Original Mortgage
$102,500
Interest Rate
7.14%
Mortgage Type
Commercial
Create a Home Valuation Report for This Property
The Home Valuation Report is an in-depth analysis detailing your home's value as well as a comparison with similar homes in the area
Home Values in the Area
Average Home Value in this Area
Purchase History
| Date | Buyer | Sale Price | Title Company |
|---|---|---|---|
| Three Willow Llc | -- | Security 1St Title Llc | |
| Bickford Brian R | -- | None Available | |
| Bickford Brian | -- | Midwest Title Company Inc | |
| Stockton Development Company Llc | -- | Midwest Title Company |
Source: Public Records
Mortgage History
| Date | Status | Borrower | Loan Amount |
|---|---|---|---|
| Previous Owner | Bickford Brian | $80,500 | |
| Previous Owner | Stockton Development Company Llc | $102,500 |
Source: Public Records
Tax History
| Year | Tax Paid | Tax Assessment Tax Assessment Total Assessment is a certain percentage of the fair market value that is determined by local assessors to be the total taxable value of land and additions on the property. | Land | Improvement |
|---|---|---|---|---|
| 2025 | $2,860 | $25,226 | $3,503 | $21,723 |
| 2024 | $2,860 | $22,501 | $3,503 | $18,998 |
| 2023 | $3,056 | $23,751 | $3,418 | $20,333 |
| 2022 | $2,960 | $22,750 | $3,075 | $19,675 |
| 2021 | $2,888 | $21,500 | $3,075 | $18,425 |
| 2020 | $2,923 | $21,250 | $3,075 | $18,175 |
| 2019 | $2,780 | $20,500 | $3,075 | $17,425 |
| 2018 | $2,735 | $19,750 | $3,075 | $16,675 |
| 2017 | $2,575 | $18,750 | $3,075 | $15,675 |
| 2016 | $2,456 | $17,751 | $2,223 | $15,528 |
| 2015 | $2,520 | $18,501 | $2,223 | $16,278 |
| 2013 | -- | $21,251 | $3,418 | $17,833 |
Source: Public Records
Map
Nearby Homes
- 647 W Lanesfield St
- 663 W Lanesfield St
- 639 W Lanesfield St
- 238 S Elm St
- 17746 Red Bird St
- 17747 Red Bird St
- 329 S Center St
- 300 N Hickory St
- 133 N White Dr
- 14728 Four Corners Rd
- 526 S Center St
- 341 N Pine St
- 183rd 56 Hwy
- 319 N Alder St
- 350 N Cottonwood St
- 360 W Madison St
- 789 Pinewood St
- 900 E Santa fe St
- 559 E Apache St
- 496 E Willow St
Your Personal Tour Guide
Ask me questions while you tour the home.