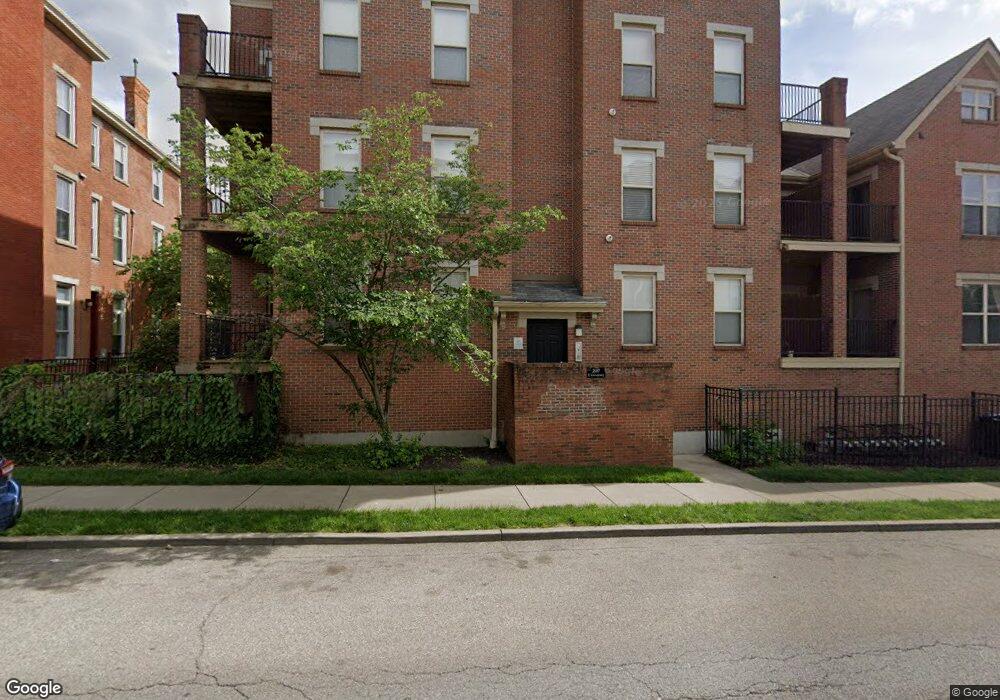
207 E University Ave Unit 9A Cincinnati, OH 45219
Corryville NeighborhoodEstimated Value: $248,000 - $273,000
2
Beds
1
Bath
905
Sq Ft
$287/Sq Ft
Est. Value
About This Home
This home is located at 207 E University Ave Unit 9A, Cincinnati, OH 45219 and is currently estimated at $260,153, approximately $287 per square foot. 207 E University Ave Unit 9A is a home located in Hamilton County with nearby schools including William H. Taft Elementary School, Robert A. Taft Information Technology High School, and Clark Montessori High School.
Ownership History
Date
Name
Owned For
Owner Type
Purchase Details
Closed on
Jun 10, 2009
Sold by
Reshard Leroy and Reshard Audrey
Bought by
Alexander Elizabeth S
Current Estimated Value
Home Financials for this Owner
Home Financials are based on the most recent Mortgage that was taken out on this home.
Original Mortgage
$112,500
Outstanding Balance
$71,918
Interest Rate
4.99%
Mortgage Type
New Conventional
Estimated Equity
$188,235
Purchase Details
Closed on
Aug 4, 2005
Sold by
Jfp Properties Ltd
Bought by
Reshard Leroy and Reshard Audrey
Home Financials for this Owner
Home Financials are based on the most recent Mortgage that was taken out on this home.
Original Mortgage
$115,200
Interest Rate
5.8%
Mortgage Type
Fannie Mae Freddie Mac
Create a Home Valuation Report for This Property
The Home Valuation Report is an in-depth analysis detailing your home's value as well as a comparison with similar homes in the area
Home Values in the Area
Average Home Value in this Area
Purchase History
| Date | Buyer | Sale Price | Title Company |
|---|---|---|---|
| Alexander Elizabeth S | $150,000 | Lawyers Title Commonwealth C | |
| Reshard Leroy | -- | Vantage Land Title Inc |
Source: Public Records
Mortgage History
| Date | Status | Borrower | Loan Amount |
|---|---|---|---|
| Open | Alexander Elizabeth S | $112,500 | |
| Previous Owner | Reshard Leroy | $115,200 |
Source: Public Records
Tax History Compared to Growth
Tax History
| Year | Tax Paid | Tax Assessment Tax Assessment Total Assessment is a certain percentage of the fair market value that is determined by local assessors to be the total taxable value of land and additions on the property. | Land | Improvement |
|---|---|---|---|---|
| 2024 | $4,238 | $66,948 | $8,750 | $58,198 |
| 2023 | $4,246 | $66,948 | $8,750 | $58,198 |
| 2022 | $3,519 | $49,907 | $7,525 | $42,382 |
| 2021 | $3,459 | $49,907 | $7,525 | $42,382 |
| 2020 | $3,469 | $49,907 | $7,525 | $42,382 |
| 2019 | $3,810 | $49,907 | $7,525 | $42,382 |
| 2018 | $580 | $49,907 | $7,525 | $42,382 |
| 2017 | $559 | $49,907 | $7,525 | $42,382 |
| 2016 | $574 | $51,450 | $7,546 | $43,904 |
| 2015 | $514 | $51,450 | $7,546 | $43,904 |
| 2014 | $516 | $51,450 | $7,546 | $43,904 |
| 2013 | $535 | $52,500 | $7,700 | $44,800 |
Source: Public Records
Map
Nearby Homes
- 214 Donahue St
- 216 Donahue St
- 2815 Highland Ave
- 207 Stetson St
- 2656 Bellevue Ave
- 2709 Euclid Ave
- 252 Stetson St
- 3012 Burnet Ave
- 2814 Jefferson Ave
- 2408 Highland Ave
- 3153 Bishop St
- 3202 Bishop St
- 3157 Bishop St
- 2344 Highland Ave
- 3212 Glendora Ave
- 344 Helen St
- 321 Helen St
- 2312 Highland Ave
- 278 Mcgregor Ave
- 316 Mcgregor Ave
- 207 E University Ave Unit A8
- 207 E University Ave Unit 6A
- 207 E University Ave Unit 7A
- 207 E University Ave Unit 10A
- 207 E University Ave
- 207 E University Ave Unit 11A
- 207 E University Ave Unit 8A
- 203 E University Ave Unit 1A
- 203 E University Ave Unit 2A
- 203 E University Ave Unit 3A
- 203 E University Ave
- 203 E University Ave Unit 5A
- 203 E University Ave Unit 4A
- 203 E University Ave Unit A4
- 203 E University Ave Unit A3
- 203 E University Ave Unit A5
- 203 E University Ave Unit A1
- 2822 Eden Ave Unit 2B
- 2822 Eden Ave
- 2822 Eden Ave Unit 3B