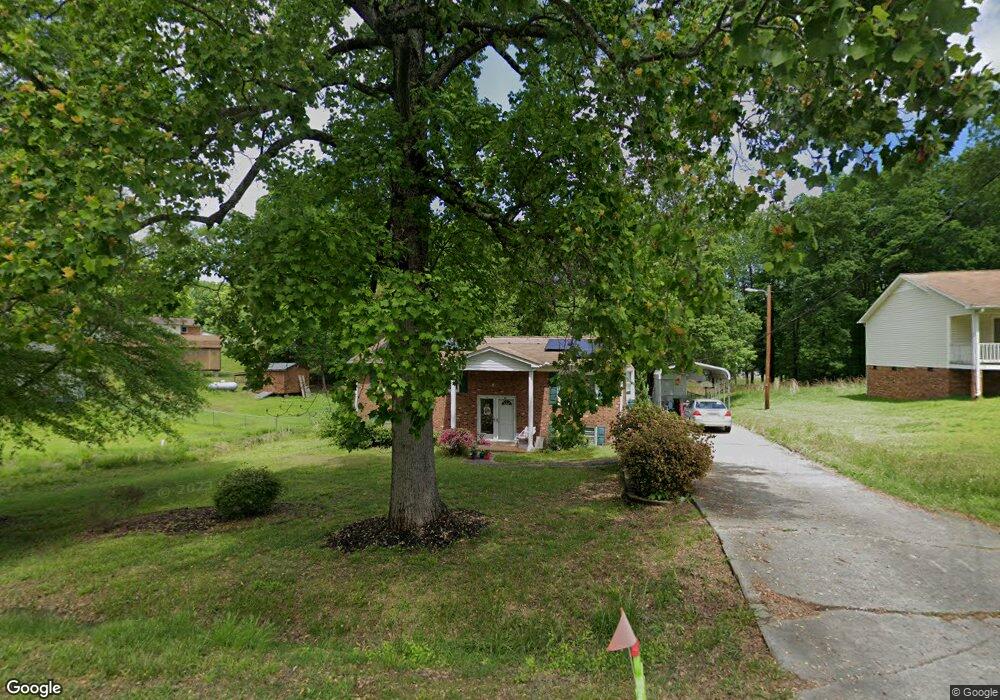
207 Elaine St Trinity, NC 27370
Estimated Value: $237,000 - $281,000
3
Beds
3
Baths
2,039
Sq Ft
$126/Sq Ft
Est. Value
About This Home
This home is located at 207 Elaine St, Trinity, NC 27370 and is currently estimated at $256,553, approximately $125 per square foot. 207 Elaine St is a home located in Randolph County with nearby schools including Trindale Elementary School, Wheatmore Middle School, and Wheatmore High School.
Ownership History
Date
Name
Owned For
Owner Type
Purchase Details
Closed on
Oct 27, 2020
Sold by
Mcintosh Steven E and Mcintosh Alicia F
Bought by
Gains Isaac Mischa and Dunn Sara H
Current Estimated Value
Home Financials for this Owner
Home Financials are based on the most recent Mortgage that was taken out on this home.
Original Mortgage
$176,739
Outstanding Balance
$156,553
Interest Rate
2.8%
Mortgage Type
FHA
Estimated Equity
$100,000
Purchase Details
Closed on
Sep 11, 2009
Sold by
Cox Lyman G and Cox Maude L
Bought by
Mcintosh Steven E and Mcintosh Alicia F
Home Financials for this Owner
Home Financials are based on the most recent Mortgage that was taken out on this home.
Original Mortgage
$129,609
Interest Rate
5.19%
Mortgage Type
FHA
Purchase Details
Closed on
Feb 11, 1988
Bought by
Mcintosh Steven E Mcintosh Alicia
Purchase Details
Closed on
Feb 5, 1988
Bought by
Mcintosh Steven E Mcintosh Alicia
Create a Home Valuation Report for This Property
The Home Valuation Report is an in-depth analysis detailing your home's value as well as a comparison with similar homes in the area
Home Values in the Area
Average Home Value in this Area
Purchase History
| Date | Buyer | Sale Price | Title Company |
|---|---|---|---|
| Gains Isaac Mischa | $180,000 | None Available | |
| Mcintosh Steven E | $132,000 | None Available | |
| Mcintosh Steven E Mcintosh Alicia | $56,000 | -- | |
| Mcintosh Steven E Mcintosh Alicia | $56,000 | -- |
Source: Public Records
Mortgage History
| Date | Status | Borrower | Loan Amount |
|---|---|---|---|
| Open | Gains Isaac Mischa | $176,739 | |
| Previous Owner | Mcintosh Steven E | $129,609 |
Source: Public Records
Tax History
| Year | Tax Paid | Tax Assessment Tax Assessment Total Assessment is a certain percentage of the fair market value that is determined by local assessors to be the total taxable value of land and additions on the property. | Land | Improvement |
|---|---|---|---|---|
| 2025 | $1,942 | $186,180 | $47,140 | $139,040 |
| 2024 | $1,923 | $186,180 | $47,140 | $139,040 |
| 2023 | $1,923 | $186,180 | $47,140 | $139,040 |
| 2022 | $1,436 | $120,770 | $23,080 | $97,690 |
| 2021 | $1,431 | $120,770 | $23,080 | $97,690 |
| 2020 | $1,387 | $119,330 | $23,080 | $96,250 |
| 2019 | $1,387 | $119,330 | $23,080 | $96,250 |
| 2018 | $1,313 | $110,210 | $20,050 | $90,160 |
| 2016 | $1,286 | $110,213 | $20,050 | $90,163 |
| 2015 | $1,291 | $110,213 | $20,050 | $90,163 |
| 2014 | $1,291 | $110,213 | $20,050 | $90,163 |
Source: Public Records
Map
Nearby Homes
- 112 Elaine St
- 209 Rivermeade Dr
- 0 Darr Rd Unit CAR4318740
- 0 Interstate Dr
- 902 Brittany Way
- 209 Purvis Ln
- 3813 Salisbury St
- 5526 Avery Dr
- 5528 Avery Dr
- 1606 Chelsea Square
- 110 Renola Dr
- 201 Maplewood Ct
- 10812, 10822, 10828 N Main St
- 5679 Carrington Ct
- 1004 Victory Dr
- 1105 Victory Dr
- KYLE Plan at English Farm
- PENWELL Plan at English Farm
- HANOVER - EXPRESS Plan at English Farm
- CALI Plan at English Farm
Your Personal Tour Guide
Ask me questions while you tour the home.