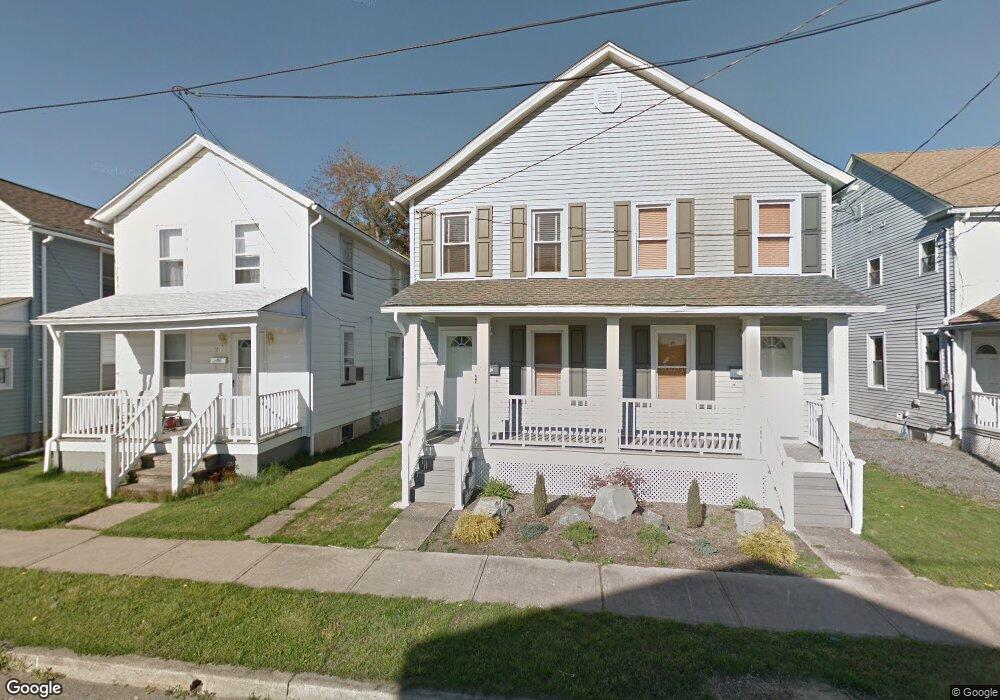
207 Factory St Unit 9 Luzerne, PA 18709
Estimated Value: $204,000 - $249,000
--
Bed
--
Bath
2,844
Sq Ft
$78/Sq Ft
Est. Value
About This Home
This home is located at 207 Factory St Unit 9, Luzerne, PA 18709 and is currently estimated at $221,682, approximately $77 per square foot. 207 Factory St Unit 9 is a home located in Luzerne County with nearby schools including Wyoming Valley West Senior High School, St. Hedwig Elementary School, and Good Shepherd Academy.
Ownership History
Date
Name
Owned For
Owner Type
Purchase Details
Closed on
May 25, 2012
Sold by
Secretary Of Housing & Urban Development
Bought by
Popovitch Ryan J
Current Estimated Value
Home Financials for this Owner
Home Financials are based on the most recent Mortgage that was taken out on this home.
Original Mortgage
$100,218
Outstanding Balance
$68,832
Interest Rate
3.64%
Mortgage Type
FHA
Estimated Equity
$152,850
Purchase Details
Closed on
Dec 29, 2011
Sold by
Jpmorgan Chase Bank National Association
Bought by
Secretary Of Housing & Urban Development
Purchase Details
Closed on
Nov 22, 2011
Sold by
Solack Lynnette and Chase Home Finance Llc
Bought by
Jpmorgan Chase Bank National Association
Purchase Details
Closed on
Oct 12, 2007
Sold by
Vogel Raymond A and Mattson Nancy
Bought by
Kalderon Rafy
Create a Home Valuation Report for This Property
The Home Valuation Report is an in-depth analysis detailing your home's value as well as a comparison with similar homes in the area
Home Values in the Area
Average Home Value in this Area
Purchase History
| Date | Buyer | Sale Price | Title Company |
|---|---|---|---|
| Popovitch Ryan J | $98,078 | None Available | |
| Secretary Of Housing & Urban Development | -- | None Available | |
| Jpmorgan Chase Bank National Association | $1,143 | None Available | |
| Kalderon Rafy | $40,000 | None Available |
Source: Public Records
Mortgage History
| Date | Status | Borrower | Loan Amount |
|---|---|---|---|
| Open | Popovitch Ryan J | $100,218 |
Source: Public Records
Tax History Compared to Growth
Tax History
| Year | Tax Paid | Tax Assessment Tax Assessment Total Assessment is a certain percentage of the fair market value that is determined by local assessors to be the total taxable value of land and additions on the property. | Land | Improvement |
|---|---|---|---|---|
| 2025 | $2,570 | $89,100 | $19,300 | $69,800 |
| 2024 | $2,564 | $89,100 | $19,300 | $69,800 |
| 2023 | $2,508 | $89,100 | $19,300 | $69,800 |
| 2022 | $2,443 | $89,100 | $19,300 | $69,800 |
| 2021 | $2,363 | $89,100 | $19,300 | $69,800 |
| 2020 | $2,363 | $89,100 | $19,300 | $69,800 |
| 2019 | $2,259 | $89,100 | $19,300 | $69,800 |
| 2018 | $2,152 | $89,100 | $19,300 | $69,800 |
| 2017 | $2,104 | $89,100 | $19,300 | $69,800 |
| 2016 | -- | $89,100 | $19,300 | $69,800 |
| 2015 | -- | $89,100 | $19,300 | $69,800 |
| 2014 | -- | $89,100 | $19,300 | $69,800 |
Source: Public Records
Map
Nearby Homes
- 258 Factory St
- 114 W Union St
- 807 Woodland Dr
- 107 Eley St
- 127 Division St
- 476 Grove St
- 117 W Pettebone St
- 41 Church St
- 942 Wyoming Ave
- 520 Charles St
- 38 Hedge Place
- 8102 Julian Dr
- Dev 4 Jackson Hill Estates
- 645 Rear Main St
- 278 Pringle St
- 36 Snowden St
- 33 Pomona St
- 16 Flannagan St
- 161 Oliver St
- 18 Linden St