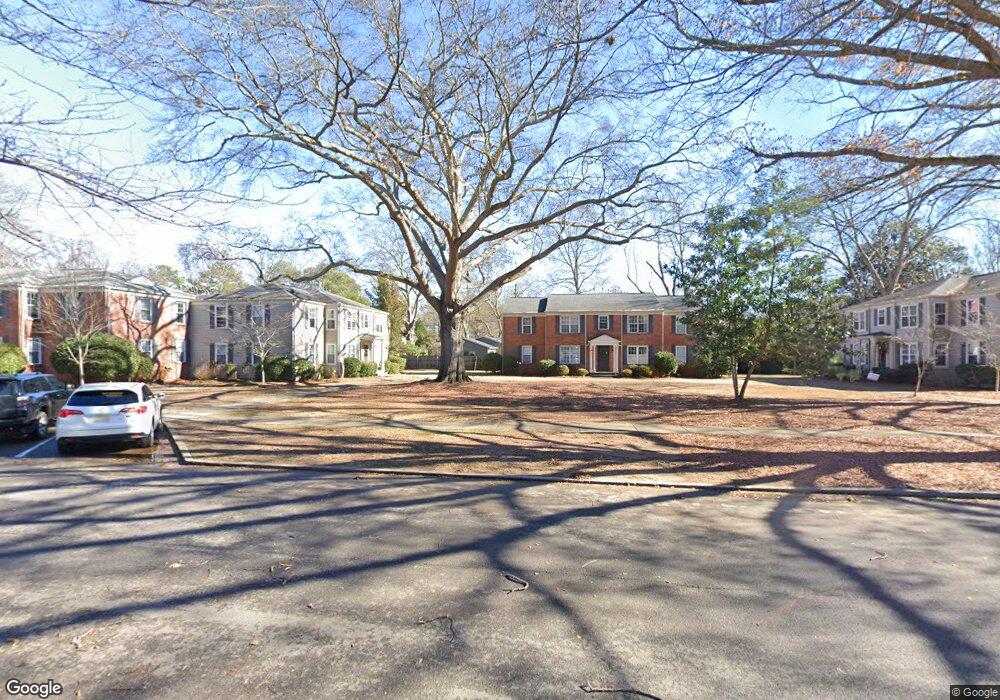
207 Fox Hall Rd Unit 207A Mountain Brook, AL 35213
Estimated Value: $264,000 - $286,000
2
Beds
1
Bath
776
Sq Ft
$352/Sq Ft
Est. Value
About This Home
This home is located at 207 Fox Hall Rd Unit 207A, Mountain Brook, AL 35213 and is currently estimated at $272,884, approximately $351 per square foot. 207 Fox Hall Rd Unit 207A is a home located in Jefferson County with nearby schools including Crestline Elementary School, Mt. Brook Junior High School, and Mt. Brook High School.
Ownership History
Date
Name
Owned For
Owner Type
Purchase Details
Closed on
Jan 28, 2016
Sold by
Smith Haller Jackson
Bought by
Arcinegas Joaquin and Arcinegas Beatriz
Current Estimated Value
Purchase Details
Closed on
May 24, 2013
Sold by
Smith Rayford Agee
Bought by
Smith Haller Jackson
Purchase Details
Closed on
Jun 13, 2008
Sold by
Wheeler Lisa
Bought by
Smith Haller Jackson and Smith Rayford Agee
Home Financials for this Owner
Home Financials are based on the most recent Mortgage that was taken out on this home.
Original Mortgage
$100,000
Interest Rate
6.02%
Mortgage Type
Future Advance Clause Open End Mortgage
Purchase Details
Closed on
Apr 19, 2002
Sold by
Hollingsworth Dany Demi and Demi Dany M
Bought by
Newman Lisa S
Home Financials for this Owner
Home Financials are based on the most recent Mortgage that was taken out on this home.
Original Mortgage
$83,500
Interest Rate
7.07%
Purchase Details
Closed on
Oct 23, 1997
Sold by
Hill Carla M
Bought by
Schoel David D
Create a Home Valuation Report for This Property
The Home Valuation Report is an in-depth analysis detailing your home's value as well as a comparison with similar homes in the area
Home Values in the Area
Average Home Value in this Area
Purchase History
| Date | Buyer | Sale Price | Title Company |
|---|---|---|---|
| Arcinegas Joaquin | $128,000 | -- | |
| Smith Haller Jackson | $80,000 | -- | |
| Smith Haller Jackson | $128,000 | None Available | |
| Newman Lisa S | $87,900 | -- | |
| Schoel David D | $69,500 | Land Title Comany |
Source: Public Records
Mortgage History
| Date | Status | Borrower | Loan Amount |
|---|---|---|---|
| Previous Owner | Smith Haller Jackson | $100,000 | |
| Previous Owner | Newman Lisa S | $83,500 |
Source: Public Records
Tax History Compared to Growth
Tax History
| Year | Tax Paid | Tax Assessment Tax Assessment Total Assessment is a certain percentage of the fair market value that is determined by local assessors to be the total taxable value of land and additions on the property. | Land | Improvement |
|---|---|---|---|---|
| 2024 | $5,284 | $49,040 | -- | $49,040 |
| 2022 | $3,713 | $7,080 | $0 | $7,080 |
| 2021 | $3,595 | $7,080 | $0 | $7,080 |
| 2020 | $3,377 | $7,080 | $0 | $7,080 |
| 2019 | $2,855 | $28,840 | $0 | $0 |
| 2018 | $2,881 | $26,160 | $0 | $0 |
| 2017 | $2,590 | $26,160 | $0 | $0 |
| 2016 | $1,188 | $12,540 | $0 | $0 |
| 2015 | $1,188 | $12,540 | $0 | $0 |
| 2014 | $1,280 | $12,120 | $0 | $0 |
| 2013 | $1,280 | $12,120 | $0 | $0 |
Source: Public Records
Map
Nearby Homes
- 632 Bienville Ln
- 4109 Brook Way
- 633 Hagood St
- 4026 Montevallo Rd S
- 139 Glenhill Dr
- 112 Heritage Cir
- 113 Lorena Ln
- 1113 Gladstone Ave
- 4324 Montevallo Rd
- 4217 Groover Dr
- 11 Montcrest Dr
- 4321 Montevallo Rd
- 4324 Warren Rd
- 412 Art Hanes Blvd
- 4137 Churchill Dr
- 661 Pamela St
- 10 W Montcrest Dr
- 136 Fairmont Dr Unit 20
- 136 Fairmont Dr
- 158 Fairmont Dr
- 200 Fox Hall Rd Unit 200C
- 207 Fox Hall Rd Unit 207C
- 207 Fox Hall Rd
- 207 Fox Hall Rd Unit 207B
- 200 Fox Hall Rd Unit 200B
- 200 Fox Hall Rd
- 107 Fox Hall Rd
- 107 Fox Hall Rd Unit 107C
- 107 Fox Hall Rd
- 100 Fox Hall Rd
- 100 Fox Hall Rd
- 100 Fox Hall Rd
- 200 Fox Hall Rd Unit 200A
- 107 Fox Hall Rd Unit 107B
- 100 Fox Hall Rd Unit 100B
- 107 Fox Hall Rd Unit 107 B Building 10
- 107 Fox Hall Rd Unit B
- 200 Fox Hall Rd Unit C
- 207 Fox Hall Rd Unit D
- 207 Fox Hall Rd Unit B