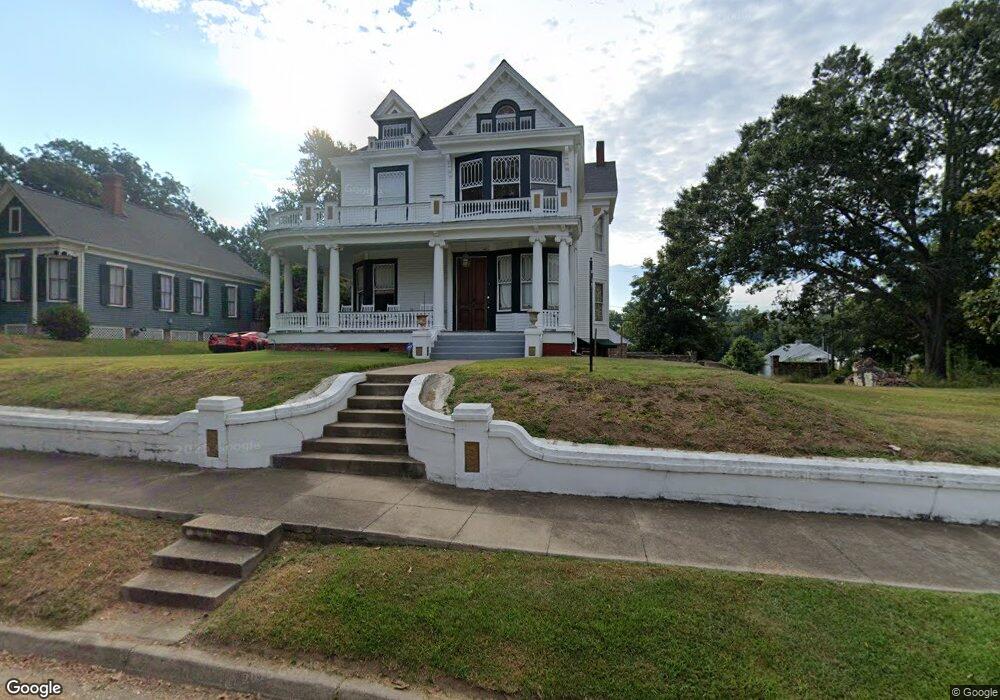
207 Linton Ave Natchez, MS 39120
Estimated Value: $408,587 - $483,000
5
Beds
--
Bath
3,410
Sq Ft
$130/Sq Ft
Est. Value
About This Home
This home is located at 207 Linton Ave, Natchez, MS 39120 and is currently estimated at $444,897, approximately $130 per square foot. 207 Linton Ave is a home located in Adams County with nearby schools including McLaurin Elementary School, Susie B. West Primary School, and Joseph L. Frazier Primary School.
Ownership History
Date
Name
Owned For
Owner Type
Purchase Details
Closed on
Jul 23, 2007
Sold by
Brady
Bought by
Main Pass Llc
Current Estimated Value
Purchase Details
Closed on
Jan 19, 2007
Sold by
Brady Virginia Carrazza and Brady Albert
Bought by
Brady
Create a Home Valuation Report for This Property
The Home Valuation Report is an in-depth analysis detailing your home's value as well as a comparison with similar homes in the area
Home Values in the Area
Average Home Value in this Area
Purchase History
| Date | Buyer | Sale Price | Title Company |
|---|---|---|---|
| Main Pass Llc | -- | -- | |
| Brady | -- | -- |
Source: Public Records
Tax History Compared to Growth
Tax History
| Year | Tax Paid | Tax Assessment Tax Assessment Total Assessment is a certain percentage of the fair market value that is determined by local assessors to be the total taxable value of land and additions on the property. | Land | Improvement |
|---|---|---|---|---|
| 2024 | $3,747 | $22,445 | $0 | $0 |
| 2023 | $3,747 | $22,445 | $2,700 | $19,745 |
| 2022 | $3,540 | $22,445 | $0 | $0 |
| 2021 | $3,528 | $22,445 | $0 | $0 |
| 2020 | $3,528 | $21,858 | $0 | $0 |
| 2019 | $3,494 | $21,858 | $0 | $0 |
| 2018 | $3,167 | $19,967 | $0 | $0 |
| 2017 | $3,197 | $19,967 | $0 | $0 |
| 2016 | $2,747 | $17,415 | $0 | $0 |
| 2015 | $2,709 | $17,415 | $0 | $0 |
| 2014 | $2,717 | $17,415 | $0 | $0 |
Source: Public Records
Map
Nearby Homes