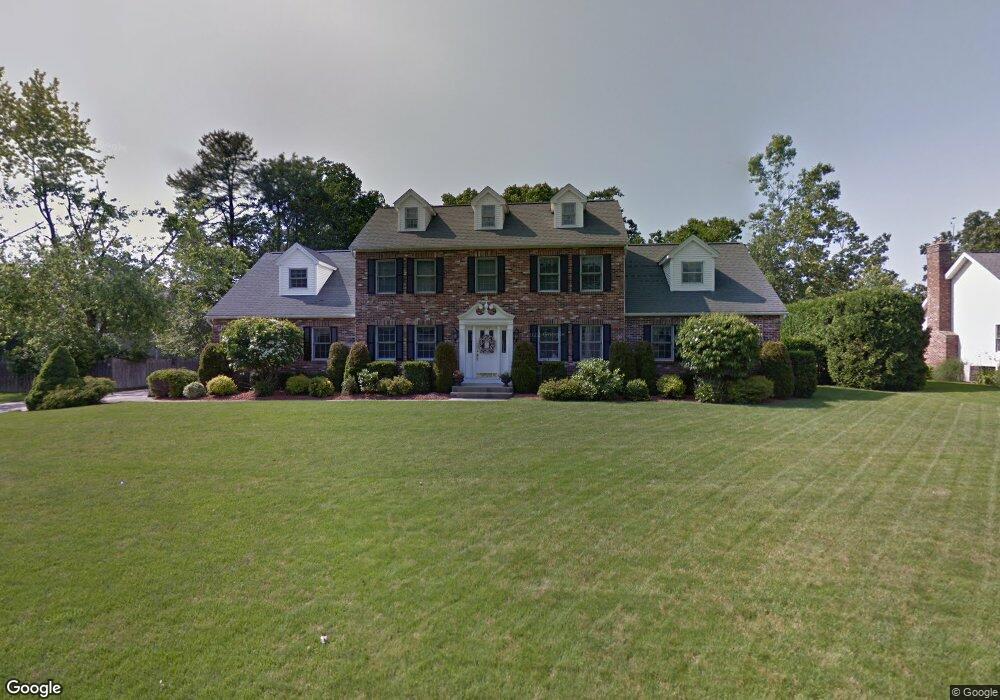
207 Munger Hill Rd Westfield, MA 01085
Estimated Value: $662,936 - $797,000
4
Beds
3
Baths
3,464
Sq Ft
$205/Sq Ft
Est. Value
About This Home
This home is located at 207 Munger Hill Rd, Westfield, MA 01085 and is currently estimated at $710,484, approximately $205 per square foot. 207 Munger Hill Rd is a home located in Hampden County with nearby schools including Westfield High School and Saint Mary High School.
Ownership History
Date
Name
Owned For
Owner Type
Purchase Details
Closed on
Feb 18, 1992
Sold by
Morgan Homes Dev Corp
Bought by
Carley Patrick J and Carley Nancy J
Current Estimated Value
Home Financials for this Owner
Home Financials are based on the most recent Mortgage that was taken out on this home.
Original Mortgage
$192,000
Interest Rate
8.18%
Mortgage Type
Purchase Money Mortgage
Create a Home Valuation Report for This Property
The Home Valuation Report is an in-depth analysis detailing your home's value as well as a comparison with similar homes in the area
Home Values in the Area
Average Home Value in this Area
Purchase History
| Date | Buyer | Sale Price | Title Company |
|---|---|---|---|
| Carley Patrick J | $240,000 | -- |
Source: Public Records
Mortgage History
| Date | Status | Borrower | Loan Amount |
|---|---|---|---|
| Open | Carley Patrick J | $25,000 | |
| Closed | Carley Patrick J | $12,000 | |
| Closed | Carley Patrick J | $190,000 | |
| Closed | Carley Patrick J | $192,000 |
Source: Public Records
Tax History Compared to Growth
Tax History
| Year | Tax Paid | Tax Assessment Tax Assessment Total Assessment is a certain percentage of the fair market value that is determined by local assessors to be the total taxable value of land and additions on the property. | Land | Improvement |
|---|---|---|---|---|
| 2025 | $9,047 | $596,000 | $160,800 | $435,200 |
| 2024 | $9,095 | $569,500 | $146,100 | $423,400 |
| 2023 | $9,002 | $525,900 | $139,100 | $386,800 |
| 2022 | $8,572 | $463,600 | $124,000 | $339,600 |
| 2021 | $4,002 | $440,100 | $116,800 | $323,300 |
| 2020 | $8,141 | $422,900 | $116,800 | $306,100 |
| 2019 | $3,704 | $403,200 | $111,600 | $291,600 |
| 2018 | $7,806 | $403,200 | $111,600 | $291,600 |
| 2017 | $7,611 | $391,900 | $112,900 | $279,000 |
| 2016 | $7,619 | $391,900 | $112,900 | $279,000 |
| 2015 | $7,073 | $381,500 | $112,900 | $268,600 |
| 2014 | $5,297 | $381,500 | $112,900 | $268,600 |
Source: Public Records
Map
Nearby Homes
- 20 Raymond Cir
- 451 Falley Dr
- 94 Pineridge Dr
- 1037 Shaker Rd
- 57 Falley Dr
- 16 Locust St
- 60 Shaker Rd
- 31 Family Ln
- 30 Cross St
- 138 Main St Unit 11
- 23 Tannery Rd Unit B
- 16 Yale St
- 0 Feeding Hills Rd
- 103 Feeding Hills Rd
- 33 George St
- 70-74 S Maple St
- 74 S Maple St
- 70 S Maple St
- 82 S Maple St Unit 11
- 82 S Maple St Unit 43