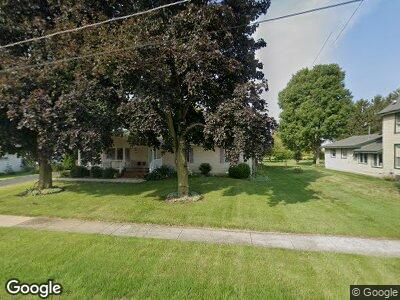
207 N Shabbona Rd Shabbona, IL 60550
Estimated Value: $179,000 - $249,000
--
Bed
--
Bath
--
Sq Ft
0.82
Acres
About This Home
This home is located at 207 N Shabbona Rd, Shabbona, IL 60550 and is currently estimated at $200,609. 207 N Shabbona Rd is a home located in DeKalb County with nearby schools including Indian Creek Elementary School, Indian Creek Middle School, and Indian Creek High School.
Ownership History
Date
Name
Owned For
Owner Type
Purchase Details
Closed on
Nov 27, 2024
Sold by
Klopotek Kristine A and Klopotek Kristine A
Bought by
Klopotek Jeffrey and Klopotek Theresa
Current Estimated Value
Home Financials for this Owner
Home Financials are based on the most recent Mortgage that was taken out on this home.
Original Mortgage
$171,000
Outstanding Balance
$170,692
Interest Rate
6.54%
Mortgage Type
New Conventional
Estimated Equity
$31,310
Purchase Details
Closed on
Sep 29, 2021
Sold by
Klopotek Kristine A
Bought by
Klopotek Kristine A and Klopotek Kristine A
Purchase Details
Closed on
Jul 20, 2007
Sold by
Broude Marsha
Bought by
Klopotek Daniel L and Klopotek Kristine A
Purchase Details
Closed on
Jul 25, 2006
Sold by
Shumaker Lee
Bought by
Broude Marsha and Carpenter Alesha
Home Financials for this Owner
Home Financials are based on the most recent Mortgage that was taken out on this home.
Original Mortgage
$120,000
Interest Rate
6.73%
Mortgage Type
New Conventional
Create a Home Valuation Report for This Property
The Home Valuation Report is an in-depth analysis detailing your home's value as well as a comparison with similar homes in the area
Home Values in the Area
Average Home Value in this Area
Purchase History
| Date | Buyer | Sale Price | Title Company |
|---|---|---|---|
| Klopotek Jeffrey | $180,000 | None Listed On Document | |
| Klopotek Kristine A | -- | Accommodation | |
| Klopotek Daniel L | $147,500 | -- | |
| Broude Marsha | $70,000 | -- |
Source: Public Records
Mortgage History
| Date | Status | Borrower | Loan Amount |
|---|---|---|---|
| Open | Klopotek Jeffrey | $171,000 | |
| Previous Owner | Klopotek Daniel L | $59,600 | |
| Previous Owner | Klopotek Daniel L | $137,450 | |
| Previous Owner | Klopotek Daniel | $140,000 | |
| Previous Owner | Broude Marsha | $120,000 |
Source: Public Records
Tax History Compared to Growth
Tax History
| Year | Tax Paid | Tax Assessment Tax Assessment Total Assessment is a certain percentage of the fair market value that is determined by local assessors to be the total taxable value of land and additions on the property. | Land | Improvement |
|---|---|---|---|---|
| 2024 | $3,710 | $54,651 | $22,808 | $31,843 |
| 2023 | $3,710 | $50,683 | $21,152 | $29,531 |
| 2022 | $3,614 | $49,145 | $20,510 | $28,635 |
| 2021 | $3,524 | $46,315 | $19,329 | $26,986 |
| 2020 | $3,395 | $43,883 | $18,314 | $25,569 |
| 2019 | $3,279 | $42,236 | $17,627 | $24,609 |
| 2018 | $3,166 | $40,472 | $16,891 | $23,581 |
| 2017 | $2,999 | $38,038 | $15,875 | $22,163 |
| 2016 | $2,887 | $36,533 | $15,247 | $21,286 |
| 2015 | -- | $34,465 | $14,384 | $20,081 |
| 2014 | -- | $34,165 | $14,259 | $19,906 |
| 2013 | -- | $35,160 | $14,674 | $20,486 |
Source: Public Records
Map
Nearby Homes
- 30 Highway 30
- 2548 Shabbona Grove Rd
- 0000 Mcgirr Rd
- 211 W Hardanger Gate
- 5065 E Sleepy Hollow Rd
- 5885 Minnegan Rd
- 375 N Pine St
- 135 N Birch St
- 145 W Eisenhower St
- 3705 Elva Rd
- 1 Chesterfield Dr
- 16205 University Rd
- 3511 Chicago Rd
- 637 Ogee Rd
- 341 Wyoming Ave
- 223 Chapman St
- 250 Peru St
- 237 Peru St
- 417 Maple Ln
- 310 Flagg St