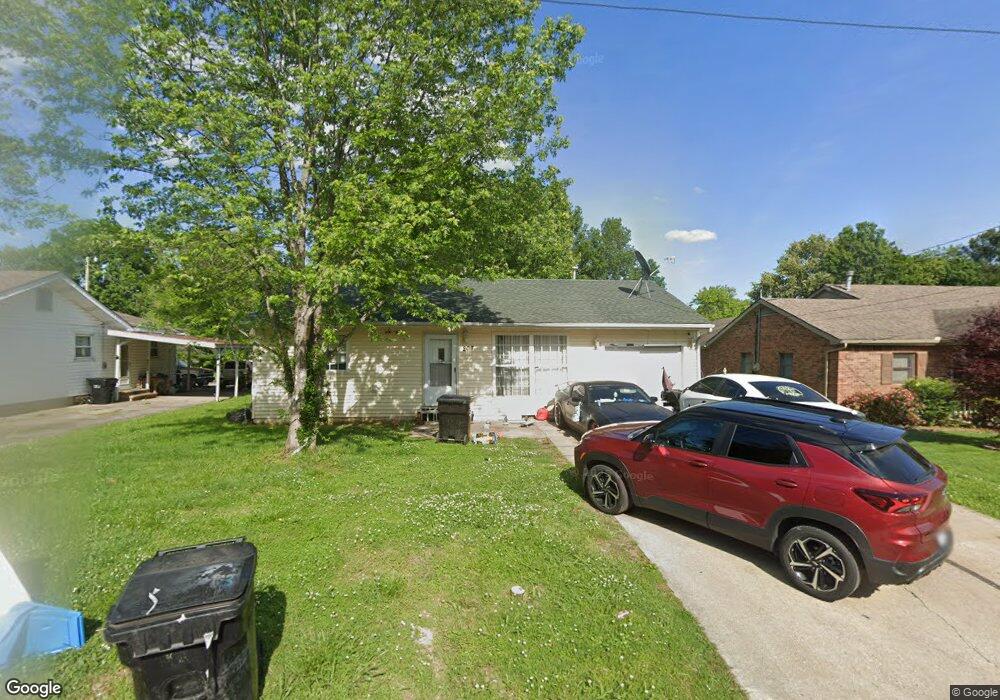
207 Oak Dr Metropolis, IL 62960
Estimated Value: $69,216 - $95,000
3
Beds
1
Bath
1,010
Sq Ft
$80/Sq Ft
Est. Value
About This Home
This home is located at 207 Oak Dr, Metropolis, IL 62960 and is currently estimated at $81,304, approximately $80 per square foot. 207 Oak Dr is a home located in Massac County with nearby schools including Massac County High School.
Ownership History
Date
Name
Owned For
Owner Type
Purchase Details
Closed on
Oct 3, 2023
Sold by
Legereit Peggy
Bought by
Stevens Homer
Current Estimated Value
Purchase Details
Closed on
Nov 26, 2016
Sold by
Potterbaum Brian
Bought by
Legereit Peggy
Purchase Details
Closed on
Apr 13, 2010
Sold by
Wyatt Howard B and Glass Cheryl
Bought by
Potterbaum Imogene and Potterbaum Ronald
Home Financials for this Owner
Home Financials are based on the most recent Mortgage that was taken out on this home.
Original Mortgage
$23,000
Interest Rate
5.02%
Create a Home Valuation Report for This Property
The Home Valuation Report is an in-depth analysis detailing your home's value as well as a comparison with similar homes in the area
Home Values in the Area
Average Home Value in this Area
Purchase History
| Date | Buyer | Sale Price | Title Company |
|---|---|---|---|
| Stevens Homer | -- | None Listed On Document | |
| Legereit Peggy | -- | -- | |
| Legereit Peggy | -- | None Listed On Document | |
| Potterbaum Imogene | -- | -- |
Source: Public Records
Mortgage History
| Date | Status | Borrower | Loan Amount |
|---|---|---|---|
| Previous Owner | Potterbaum Imogene | $23,000 |
Source: Public Records
Tax History Compared to Growth
Tax History
| Year | Tax Paid | Tax Assessment Tax Assessment Total Assessment is a certain percentage of the fair market value that is determined by local assessors to be the total taxable value of land and additions on the property. | Land | Improvement |
|---|---|---|---|---|
| 2024 | $351 | $18,348 | $1,832 | $16,516 |
| 2023 | $417 | $17,275 | $1,725 | $15,550 |
| 2022 | $1,029 | $17,275 | $1,725 | $15,550 |
| 2021 | $1,004 | $17,275 | $1,725 | $15,550 |
| 2020 | $1,082 | $17,275 | $1,725 | $15,550 |
| 2019 | $959 | $16,951 | $1,693 | $15,258 |
| 2018 | $961 | $17,275 | $1,725 | $15,550 |
| 2017 | $994 | $17,275 | $1,725 | $15,550 |
| 2016 | $906 | $16,879 | $1,685 | $15,194 |
| 2015 | $911 | $17,275 | $1,725 | $15,550 |
| 2014 | $911 | $17,275 | $1,725 | $15,550 |
| 2013 | $885 | $17,275 | $1,725 | $15,550 |
Source: Public Records
Map
Nearby Homes