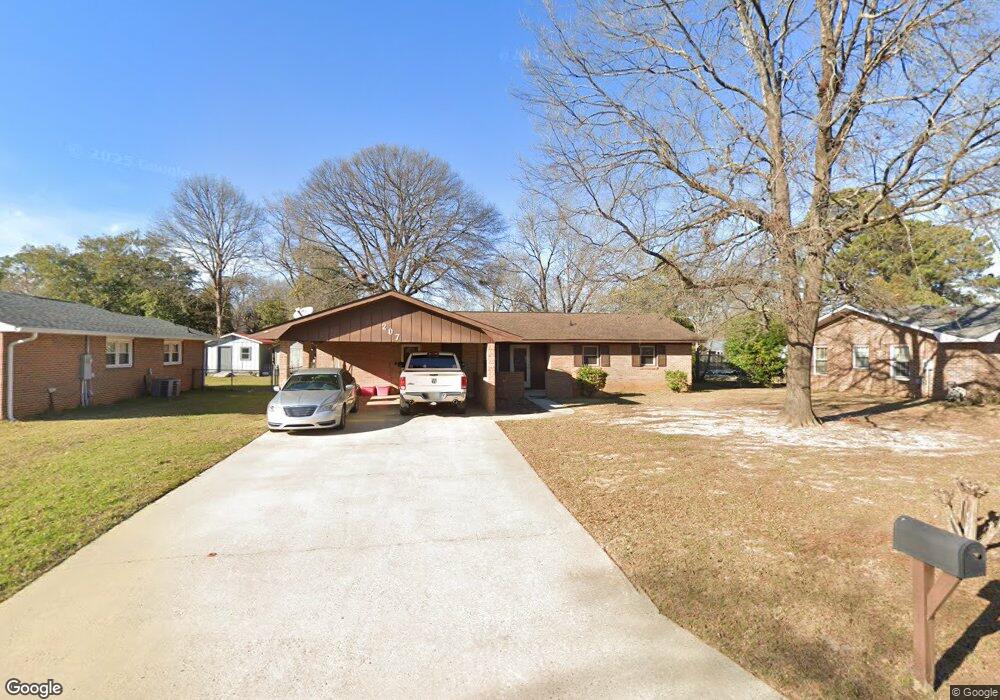
207 Pellimore Dr Warner Robins, GA 31093
Estimated Value: $162,623 - $194,000
Studio
2
Baths
1,398
Sq Ft
$128/Sq Ft
Est. Value
About This Home
This home is located at 207 Pellimore Dr, Warner Robins, GA 31093 and is currently estimated at $179,156, approximately $128 per square foot. 207 Pellimore Dr is a home located in Houston County with nearby schools including Parkwood Elementary School, Northside Middle School, and Northside High School.
Ownership History
Date
Name
Owned For
Owner Type
Purchase Details
Closed on
Jun 30, 2017
Sold by
Chaney Michelle C
Bought by
Cheney Michelle C and Chaney William
Current Estimated Value
Purchase Details
Closed on
Aug 27, 2008
Sold by
Overbey Frances L
Bought by
Chaney Michelle C
Purchase Details
Closed on
May 3, 2005
Sold by
Overbey Frances L
Bought by
Chaney Michelle Colleen and Overbey Frances L
Purchase Details
Closed on
Mar 31, 2003
Sold by
Overbey H T Estate
Bought by
Overbey Frances L
Purchase Details
Closed on
Jul 28, 1972
Sold by
Bassham Leonard C and Bassham Patsy M
Bought by
Overbey Overbey H and Overbey Frances L
Purchase Details
Closed on
Mar 21, 1972
Sold by
Cason R L & R N D/B/A Cason Builders
Bought by
Bassham Leonard C and Bassham Patsy M
Purchase Details
Closed on
Aug 25, 1971
Sold by
Selph Const & Dev Co Inc
Bought by
Cason R L & R N D/B/A Cason Builders
Purchase Details
Closed on
Oct 30, 1970
Bought by
Selph Const & Dev Co Inc
Create a Home Valuation Report for This Property
The Home Valuation Report is an in-depth analysis detailing your home's value as well as a comparison with similar homes in the area
Home Values in the Area
Average Home Value in this Area
Purchase History
| Date | Buyer | Sale Price | Title Company |
|---|---|---|---|
| Cheney Michelle C | -- | None Available | |
| Chaney Michelle C | -- | None Available | |
| Chaney Michelle Colleen | -- | None Available | |
| Overbey Frances L | -- | -- | |
| Overbey Overbey H | -- | -- | |
| Bassham Leonard C | -- | -- | |
| Cason R L & R N D/B/A Cason Builders | -- | -- | |
| Selph Const & Dev Co Inc | -- | -- |
Source: Public Records
Tax History
| Year | Tax Paid | Tax Assessment Tax Assessment Total Assessment is a certain percentage of the fair market value that is determined by local assessors to be the total taxable value of land and additions on the property. | Land | Improvement |
|---|---|---|---|---|
| 2024 | $1,580 | $49,680 | $8,000 | $41,680 |
| 2023 | $1,279 | $40,196 | $8,000 | $32,196 |
| 2022 | $736 | $33,996 | $5,400 | $28,596 |
| 2021 | $653 | $30,244 | $5,400 | $24,844 |
| 2020 | $574 | $26,720 | $5,400 | $21,320 |
| 2019 | $574 | $26,720 | $5,400 | $21,320 |
| 2018 | $574 | $26,720 | $5,400 | $21,320 |
| 2017 | $575 | $26,720 | $5,400 | $21,320 |
| 2016 | $576 | $26,720 | $5,400 | $21,320 |
| 2015 | -- | $26,720 | $5,400 | $21,320 |
| 2014 | $336 | $33,600 | $5,400 | $28,200 |
| 2013 | $336 | $33,600 | $5,400 | $28,200 |
Source: Public Records
Map
Nearby Homes
- 208 Pellimore Dr
- 203 Gawin Dr
- 156 Martin Mill Trail
- 414 Forest Lake Dr
- 317 Emory Dr
- 201 Eagles Landing Trail
- 94 Tiffany Ln
- 110 Mitchell Ct
- 112 Emory Dr
- 305 Norman Ln
- 857 Ola Dr
- 106 Scarborough Rd
- 105 Mitchell Ct
- 3220 Mason Dr
- 145 Kensington Cir
- 302 Kensington Cir
- 156 Red Birch Ln
- 118 Red Birch Ln
- 136 Red Birch Ln
- 104 Heather St
- 205 Pellimore Dr
- 209 Pellimore Dr
- 206 Gawin Dr
- 204 Gawin Dr
- 208 Gawin Dr
- 211 Pellimore Dr
- 203 Pellimore Dr
- 206 Pellimore Dr
- 204 Pellimore Dr
- 202 Gawin Dr
- 210 Gawin Dr
- 202 Pellimore Dr
- 210 Pellimore Dr
- 400 Avalon Dr
- 212 Gawin Dr
- 213 Pellimore Dr
- 402 Avalon Dr
- 207 Gawin Dr
- 207 Bedivere Dr
- 205 Gawin Dr
Your Personal Tour Guide
Ask me questions while you tour the home.