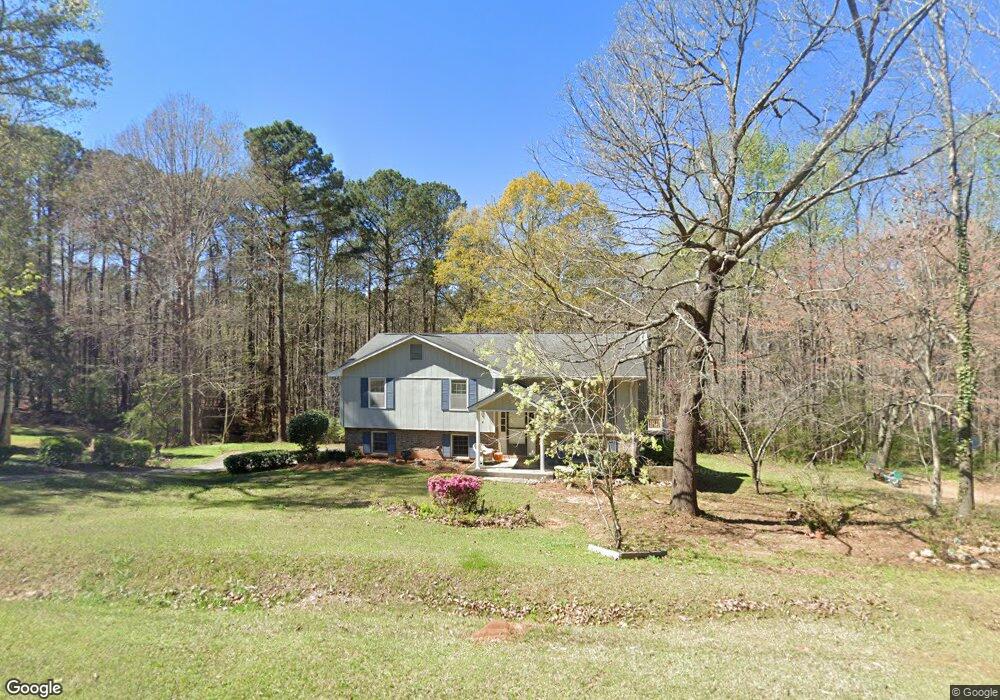
207 Pinehaven Dr Lagrange, GA 30240
Estimated Value: $219,255 - $291,000
3
Beds
3
Baths
1,313
Sq Ft
$191/Sq Ft
Est. Value
About This Home
This home is located at 207 Pinehaven Dr, Lagrange, GA 30240 and is currently estimated at $251,064, approximately $191 per square foot. 207 Pinehaven Dr is a home located in Troup County with nearby schools including Ethel W. Kight Elementary School, Hollis Hand Elementary School, and Franklin Forest Elementary School.
Ownership History
Date
Name
Owned For
Owner Type
Purchase Details
Closed on
Aug 29, 1991
Sold by
Alan A Bushey
Bought by
Bushey Lois M
Current Estimated Value
Purchase Details
Closed on
Feb 9, 1990
Sold by
James H Beard
Bought by
Alan A Bushey
Purchase Details
Closed on
Nov 15, 1984
Sold by
Dolores Harry J and Dolores Weitzel
Bought by
James H Beard
Purchase Details
Closed on
Nov 14, 1984
Sold by
B K Properties
Bought by
Dolores Harry J and Dolores Weitzel
Purchase Details
Closed on
Aug 12, 1982
Sold by
Mason N Ashley
Bought by
B K Properties
Purchase Details
Closed on
Aug 1, 1980
Sold by
James H Beard
Bought by
Mason N Ashley
Purchase Details
Closed on
Oct 21, 1976
Bought by
Glen Thurman
Create a Home Valuation Report for This Property
The Home Valuation Report is an in-depth analysis detailing your home's value as well as a comparison with similar homes in the area
Purchase History
| Date | Buyer | Sale Price | Title Company |
|---|---|---|---|
| Bushey Lois M | -- | -- | |
| Alan A Bushey | -- | -- | |
| James H Beard | $59,500 | -- | |
| Dolores Harry J | -- | -- | |
| B K Properties | $59,500 | -- | |
| Mason N Ashley | $50,000 | -- | |
| James H Beard | -- | -- | |
| Glen Thurman | -- | -- |
Source: Public Records
Tax History Compared to Growth
Tax History
| Year | Tax Paid | Tax Assessment Tax Assessment Total Assessment is a certain percentage of the fair market value that is determined by local assessors to be the total taxable value of land and additions on the property. | Land | Improvement |
|---|---|---|---|---|
| 2025 | $1,279 | $77,600 | $10,000 | $67,600 |
| 2024 | $1,279 | $73,800 | $10,000 | $63,800 |
| 2023 | $1,131 | $68,360 | $10,000 | $58,360 |
| 2022 | $1,637 | $66,400 | $10,000 | $56,400 |
| 2021 | $1,372 | $47,480 | $6,000 | $41,480 |
| 2020 | $1,372 | $47,480 | $6,000 | $41,480 |
| 2019 | $1,295 | $44,920 | $6,000 | $38,920 |
| 2018 | $1,295 | $44,920 | $6,000 | $38,920 |
| 2017 | $1,295 | $44,920 | $6,000 | $38,920 |
| 2016 | $1,208 | $42,042 | $6,000 | $36,042 |
| 2015 | $1,210 | $42,042 | $6,000 | $36,042 |
| 2014 | $1,155 | $40,145 | $6,000 | $34,145 |
| 2013 | -- | $41,351 | $6,000 | $35,351 |
Source: Public Records
Map
Nearby Homes
- 223 Pinehaven Dr
- 117 Brookwood Dr
- 146 Whitaker Rd
- 229 W Lakeview Dr
- 336 Whitaker Rd
- 104 Spring Valley Dr
- 641 Whitaker Rd
- 200 Cheyenne Dr
- 203 Shawnee Dr
- 3 Reed Dr
- 208 Highland Trail
- 0 Unit 10514554
- 217 Highland Trail
- E Angela Dr
- LOT 4 Angela Dr
- 509 Connie Dr
- 243 Oak Dr
- 610 Ginger Cir
- 0 Bradfield Dr Unit 10568803
- 190 Hill Rd
- 209 Pinehaven Dr
- 205 Pinehaven Dr
- 203 Pinehaven Dr
- 211 Pinehaven Dr
- 202 Pinehaven Dr
- 204 Pinehaven Dr
- 206 Pinehaven Dr
- 201 Pinehaven Dr
- 213 Pinehaven Dr
- 213 Pinehaven Dr Unit 1
- 200 Pinehaven Dr
- 208 Pinehaven Dr Unit 20
- 208 Pinehaven Dr
- 215 Pinehaven Dr
- 199 Weathers Dr
- 210 Pinehaven Dr
- 196 Pinehaven Dr
- 187 Weathers Dr
- 212 Pinehaven Dr
- 200 Weathers Dr