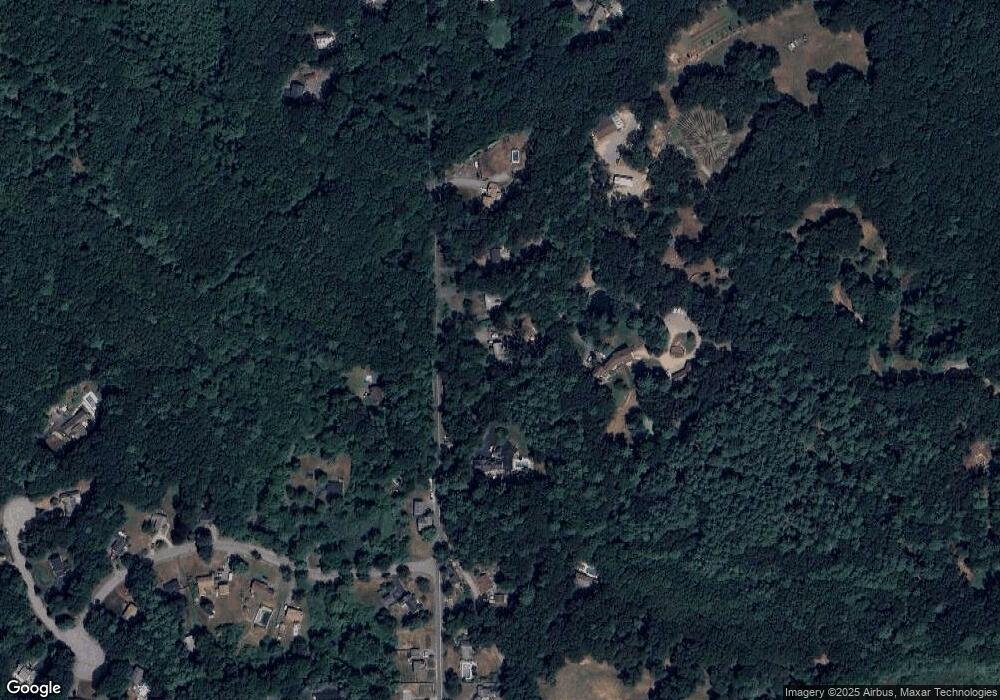
207 Pond St Georgetown, MA 01833
Estimated Value: $661,000 - $745,000
3
Beds
3
Baths
1,314
Sq Ft
$537/Sq Ft
Est. Value
About This Home
This home is located at 207 Pond St, Georgetown, MA 01833 and is currently estimated at $705,135, approximately $536 per square foot. 207 Pond St is a home located in Essex County with nearby schools including Perley Elementary School, Penn Brook School, and Georgetown High School.
Ownership History
Date
Name
Owned For
Owner Type
Purchase Details
Closed on
Jun 5, 2006
Sold by
Aulson Alan P and Aulson Maureen
Bought by
Aulson Michelle and Aulson Michelle J
Current Estimated Value
Home Financials for this Owner
Home Financials are based on the most recent Mortgage that was taken out on this home.
Original Mortgage
$250,000
Outstanding Balance
$146,815
Interest Rate
6.55%
Mortgage Type
Purchase Money Mortgage
Estimated Equity
$558,320
Purchase Details
Closed on
Apr 19, 2002
Sold by
Walsh Timothy J and Walsh Nicole K
Bought by
Aulson Alan P and Aulson Maureen
Purchase Details
Closed on
Jul 30, 1998
Sold by
Lowber K Ann
Bought by
Walsh Timothy J and Walsh Nicole K
Home Financials for this Owner
Home Financials are based on the most recent Mortgage that was taken out on this home.
Original Mortgage
$199,500
Interest Rate
6.92%
Mortgage Type
Purchase Money Mortgage
Create a Home Valuation Report for This Property
The Home Valuation Report is an in-depth analysis detailing your home's value as well as a comparison with similar homes in the area
Home Values in the Area
Average Home Value in this Area
Purchase History
| Date | Buyer | Sale Price | Title Company |
|---|---|---|---|
| Aulson Michelle | $350,000 | -- | |
| Aulson Alan P | $240,000 | -- | |
| Walsh Timothy J | $210,000 | -- |
Source: Public Records
Mortgage History
| Date | Status | Borrower | Loan Amount |
|---|---|---|---|
| Open | Walsh Timothy J | $250,000 | |
| Closed | Walsh Timothy J | $100,000 | |
| Previous Owner | Walsh Timothy J | $32,000 | |
| Previous Owner | Walsh Timothy J | $199,500 |
Source: Public Records
Tax History
| Year | Tax Paid | Tax Assessment Tax Assessment Total Assessment is a certain percentage of the fair market value that is determined by local assessors to be the total taxable value of land and additions on the property. | Land | Improvement |
|---|---|---|---|---|
| 2025 | $8,299 | $750,400 | $307,700 | $442,700 |
| 2024 | $7,482 | $596,200 | $212,200 | $384,000 |
| 2023 | $6,747 | $519,800 | $212,200 | $307,600 |
| 2022 | $6,382 | $453,300 | $184,500 | $268,800 |
| 2021 | $7,203 | $453,300 | $184,500 | $268,800 |
| 2020 | $6,879 | $432,100 | $184,500 | $247,600 |
| 2019 | $6,678 | $423,200 | $180,900 | $242,300 |
| 2018 | $5,309 | $334,300 | $180,900 | $153,400 |
| 2017 | $5,419 | $334,300 | $180,900 | $153,400 |
| 2016 | $5,305 | $334,300 | $180,900 | $153,400 |
| 2015 | $5,173 | $322,700 | $180,900 | $141,800 |
| 2014 | $4,534 | $322,700 | $180,900 | $141,800 |
Source: Public Records
Map
Nearby Homes
Your Personal Tour Guide
Ask me questions while you tour the home.