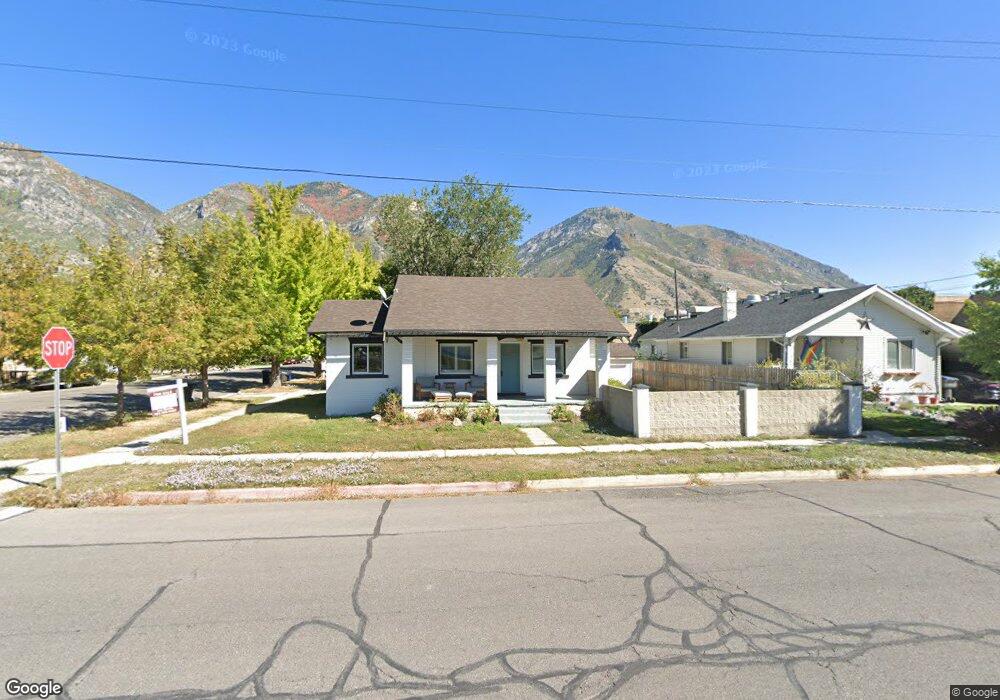
207 S 600 E Provo, UT 84606
Joaquin NeighborhoodEstimated Value: $432,049 - $457,000
4
Beds
2
Baths
1,445
Sq Ft
$310/Sq Ft
Est. Value
About This Home
This home is located at 207 S 600 E, Provo, UT 84606 and is currently estimated at $447,762, approximately $309 per square foot. 207 S 600 E is a home located in Utah County with nearby schools including Provo Peaks School, Centennial Middle School, and Timpview High School.
Ownership History
Date
Name
Owned For
Owner Type
Purchase Details
Closed on
Nov 9, 2023
Sold by
Rawle Jacob and Rawle Lindsay
Bought by
Shaw Stephan and Parrish Robert David
Current Estimated Value
Home Financials for this Owner
Home Financials are based on the most recent Mortgage that was taken out on this home.
Original Mortgage
$21,750
Outstanding Balance
$21,279
Interest Rate
7.31%
Estimated Equity
$426,483
Purchase Details
Closed on
Sep 26, 2019
Sold by
Dayton Adrian T and Dayton Merril T
Bought by
Rawle Jacob and Rawle Lindsay
Home Financials for this Owner
Home Financials are based on the most recent Mortgage that was taken out on this home.
Original Mortgage
$265,050
Interest Rate
3.5%
Mortgage Type
New Conventional
Purchase Details
Closed on
Aug 27, 2003
Sold by
Sutorius Benjamin F
Bought by
Dayton Adrian T and Dayton Merrill T
Home Financials for this Owner
Home Financials are based on the most recent Mortgage that was taken out on this home.
Original Mortgage
$118,937
Interest Rate
5.87%
Mortgage Type
FHA
Purchase Details
Closed on
Oct 30, 2001
Sold by
Elliott Ida J
Bought by
Sutorius Benjamin F
Home Financials for this Owner
Home Financials are based on the most recent Mortgage that was taken out on this home.
Original Mortgage
$94,300
Interest Rate
6.84%
Create a Home Valuation Report for This Property
The Home Valuation Report is an in-depth analysis detailing your home's value as well as a comparison with similar homes in the area
Home Values in the Area
Average Home Value in this Area
Purchase History
| Date | Buyer | Sale Price | Title Company |
|---|---|---|---|
| Shaw Stephan | -- | Cottonwood Title | |
| Rawle Jacob | -- | Metro National Title | |
| Dayton Adrian T | -- | Equity Title Agency Inc | |
| Sutorius Benjamin F | -- | First American Title Insuran |
Source: Public Records
Mortgage History
| Date | Status | Borrower | Loan Amount |
|---|---|---|---|
| Open | Shaw Stephan | $21,750 | |
| Open | Shaw Stephan | $398,646 | |
| Previous Owner | Rawle Jacob | $265,050 | |
| Previous Owner | Dayton Adrian T | $118,937 | |
| Previous Owner | Sutorius Benjamin F | $94,300 |
Source: Public Records
Tax History
| Year | Tax Paid | Tax Assessment Tax Assessment Total Assessment is a certain percentage of the fair market value that is determined by local assessors to be the total taxable value of land and additions on the property. | Land | Improvement |
|---|---|---|---|---|
| 2025 | $2,177 | $228,195 | -- | -- |
| 2024 | $2,177 | $214,280 | $0 | $0 |
| 2023 | $2,109 | $204,655 | $0 | $0 |
| 2022 | $2,296 | $224,675 | $0 | $0 |
| 2021 | $1,727 | $294,700 | $106,000 | $188,700 |
| 2020 | $1,665 | $266,400 | $96,400 | $170,000 |
| 2019 | $1,272 | $211,600 | $96,400 | $115,200 |
| 2018 | $1,130 | $190,600 | $90,400 | $100,200 |
| 2017 | $1,028 | $95,315 | $0 | $0 |
| 2016 | $959 | $82,885 | $0 | $0 |
| 2015 | $906 | $79,145 | $0 | $0 |
| 2014 | $778 | $70,840 | $0 | $0 |
Source: Public Records
Map
Nearby Homes
Your Personal Tour Guide
Ask me questions while you tour the home.